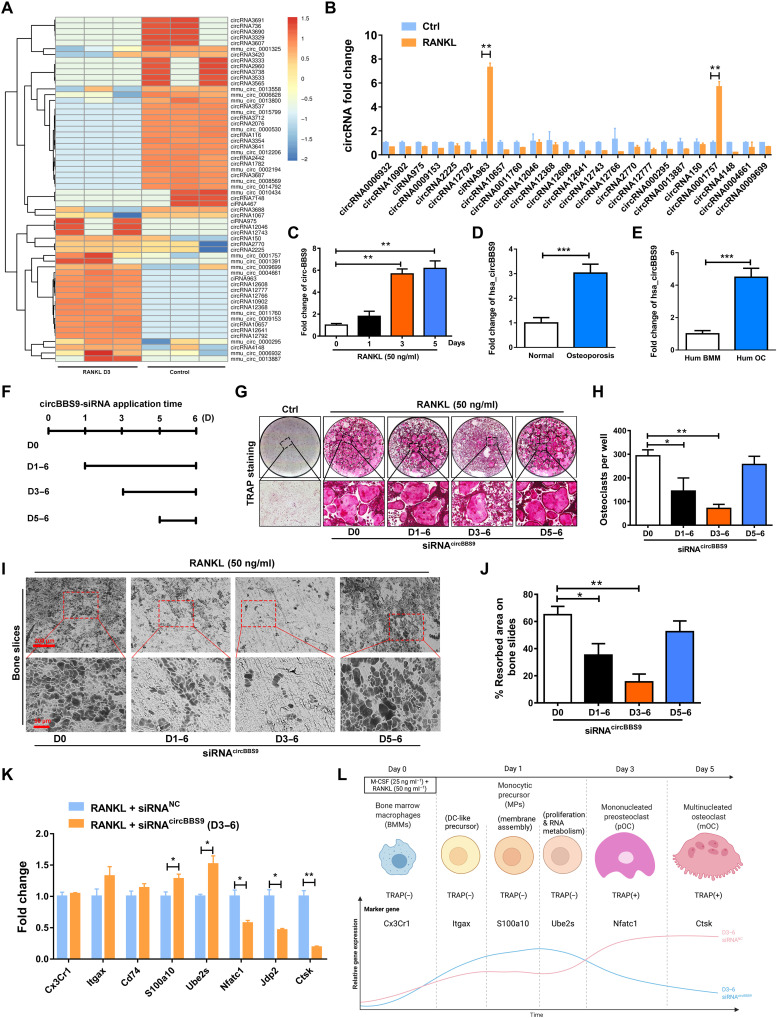
Fig. 1. CircRNA expression profiling during OC multinucleation and validation of the temporal function of circBBS9 in OCs.
(A) Heatmap analysis of differentially expressed circRNAs from RNA-seq comparing pOCs with BMMs. (B) Up-regulated circRNAs further validated the expression of pOCs by RT-qPCR. (C) Expression of circBBS9 during OC multinucleation. (D) Expression of hsa_circBBS9 in cancellous bones from the human normal and osteoporosis patients’ spine. (E) Expression of hsa_circBBS9 in human BMM and human OCs. (F and G) Representative images and quantification of TRAP-positive mononucleated or multinucleated cells per well (in a 96-well plate) in the presence of M-CSF and RANKL for 5 days after transfection with siRNAcircBBS9 on the indicated days. (H) The number of TRAP-positive cells (>3 nuclei) was quantified. (I and J) Representative images and quantification of the resorbed area in bone slices after BMMs were kept in the presence of M-CSF and RANKL for 5 days after transfection with siRNAcircBBS9 on the indicated days. Scale bars, 200 and 50 μm. (K) Marker gene expression in different stages of OCs was detected 6 days after transfection with siRNAcircBBS9 on day 3 by RT-qPCR. (L) Schematic diagram of the stepwise effects of circBBS9. *P < 0.05, **P < 0.01, and ***P < 0.001. The values and error bars are the means ± SDs. All data were analyzed using Tukey’s multiple comparisons test or Student’s t test after ANOVA.

