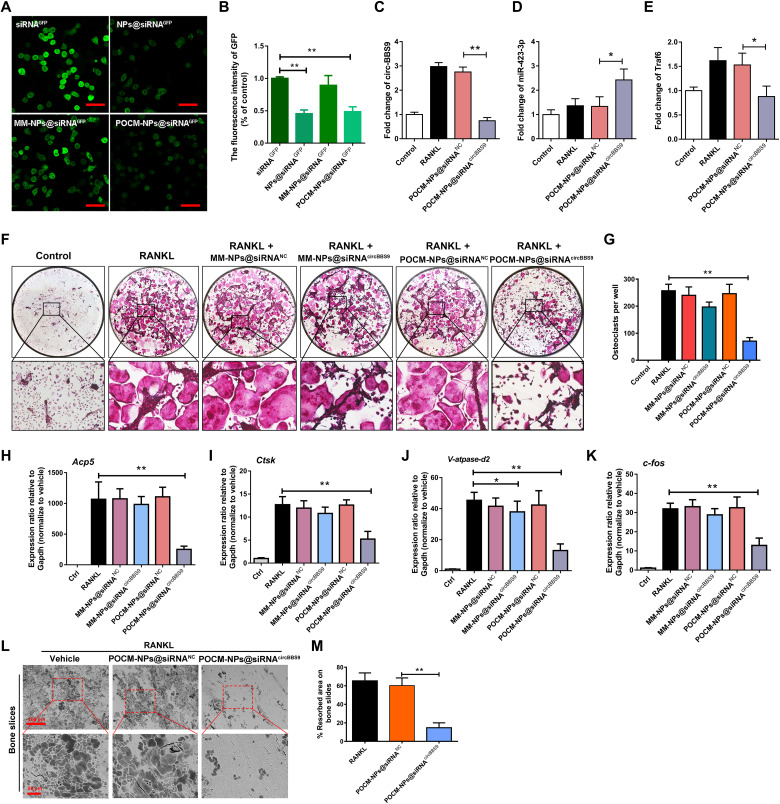
Fig. 7. POCM-NPs@siRNA enhanced gene silencing efficiency.
(A to B) Visualization of transfection efficiency in GFP-transduced RAW264.7 cells with RANKL treated for 3 days after coculture with siRNAGFP, NPs@siRNAGFP, MM-NPs@siRNAGFP, or POCM-NPs@siRNAGFP. Scale bars, 50 μm. GFP, green. (C to E) Expression of circBBS9, miR-423-3p, and Traf6 as detected by RT-qPCR. (F and G) Representative images and quantification of TRAP-positive mononucleated or multinucleated cells per well (in a 96-well plate) in the presence or absence of M-CSF and RANKL for 5 days with initial incubation with MM-NPs@siRNANC, MM-NPs@siRNAcircBBS9, POCM-NPs@siRNANC, or POCM-NPs@siRNAcircBBS9. (H to K) Gene expression levels of V-atpase-d2, c-fos, Acp5, and Ctsk in each group were assessed by RT-qPCR and reported relative to the expression level of Gapdh. (L and M) Representative images and quantification of the resorbed area in bone slices after OC treatment in each group. Scale bars, 200 and 50 μm. *P < 0.05 and **P < 0.01. The values and error bars are the means ± SDs.All data were analyzed using Tukey’s multiple comparisons test or Student’s t test after ANOVA. .

