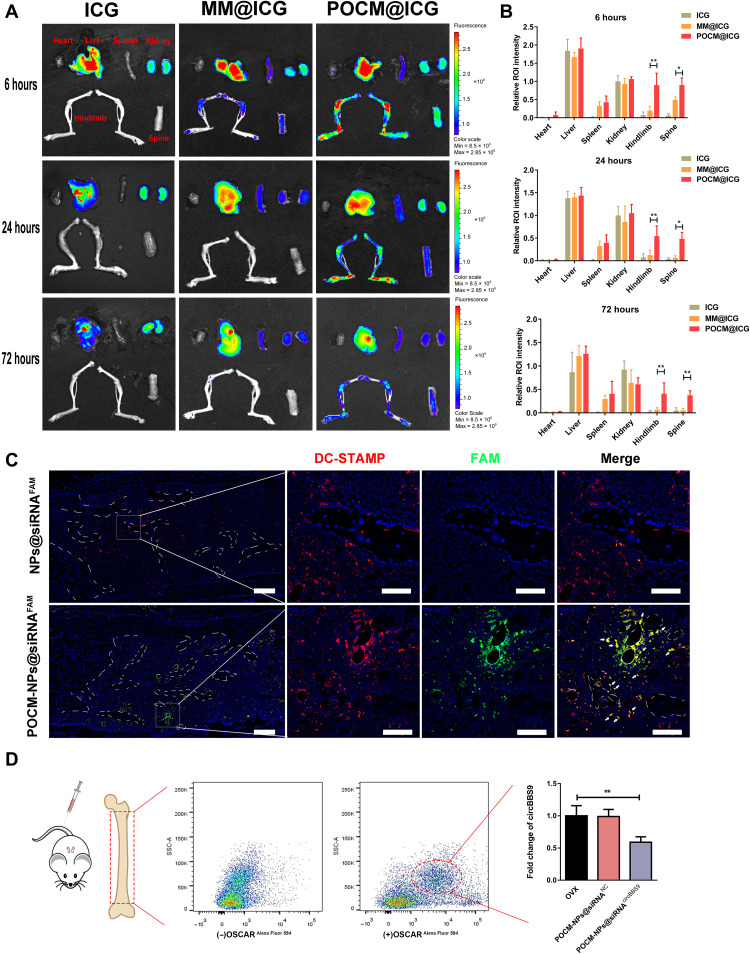
Fig. 8. Homotypic targeting of POCM-NPs@siRNAcircBBS9.
(A to B) Representative images of the biodistribution of different NPs in the heart, liver, spleen, kidneys, hindlimb, and spine 6, 24, and 72 hours after intravenous administration of ICG solution, MM@ICG, or POCM@ICG. ROI, region of interest. (C) Fluorescence images of bone sections stained with DC-STAMP antibody after treatment with POCM-NPs@siRNAFAM or NPs@siRNAFAM. Scale bars, 200 μm. Enlarged scale bars, 50 μm. FAM, green; nuclei, blue; DC-STAMP, red. (D) pOCs in bone marrow were selected by OSCAR antibody. The expression of circBBS9 in pOCs was measured by RT-qPCR in OSCAR+ cells. *P < 0.05 and **P < 0.01. The values and error bars are the means ± SEMs. All data were analyzed using unpaired Student’s t tests.

