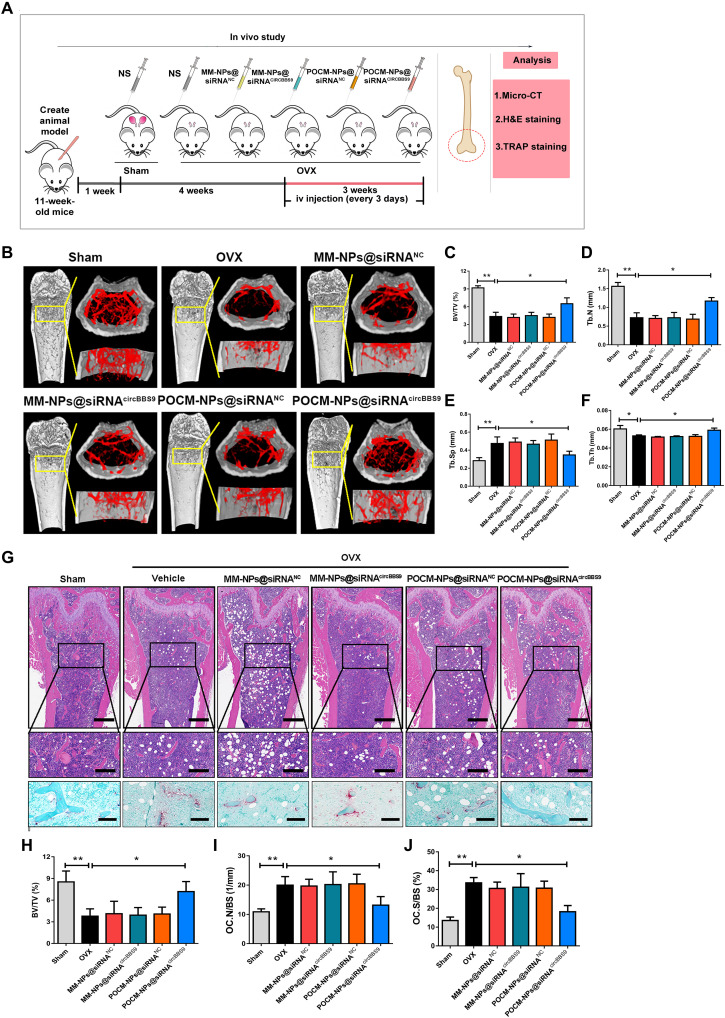
Fig. 9. Antiosteoporosis effect of POCM-NPs@siRNAcircBBS9.
(A) Schematic illustration of the process and group division of animal experiments. H&E, hematoxylin and eosin; micro-CT, micro–computed tomography. (B) Micro-CT evaluation of the femur and tibia bone masses in each group (n = 6 samples for each group). (C to F) Quantitative measurements of bone microstructure-related parameters, such as BV/TV, Tb.Sp, Tb.N, and Tb.Th, in the sham, OVX, MM-NPs@siRNANC, MM-NPs@siRNAcircBBS9, POCM-NPs@siRNANC, and POCM-NPs@siRNAcircBBS9 groups. (G to J) H&E and TRAP staining images and quantitative statistics of BV/TV, OC.N/BS, and OC.S/BS values in each group. Scale bars, 400 μm. Enlarged scale bars, 200 μm. *P < 0.05 and **P < 0.01. The values and error bars are the means ± SEMs. All data were analyzed using unpaired Student’s t tests.

