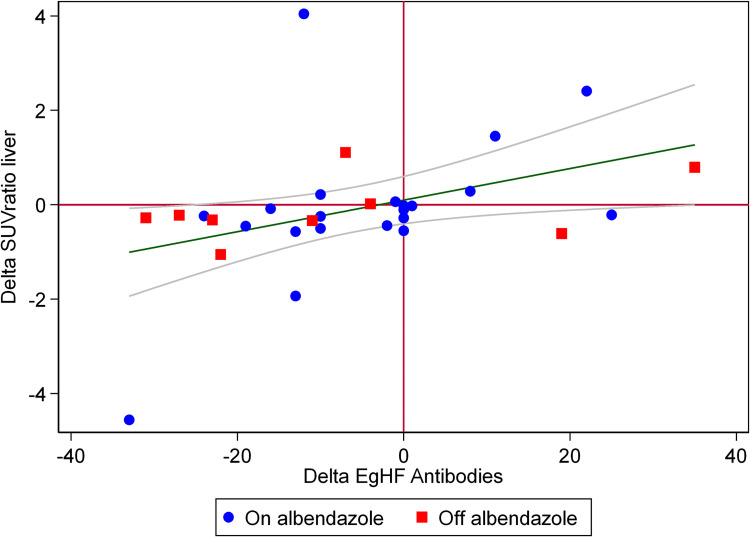
Fig 5.
The graph displays linear regression (green line) and 95% confidence intervals (grey curves) of the difference (i.e., delta) of SUVratio liver in echinococcosis manifestations between two PET/CT examination of the same patient and the delta of EgHF antibodies in the respective time intervals. Overall, a significant correlation of both variables was found (p = 0.01). When comparing, patients on continuous benzimidazole therapy (blue dots) to patients without continuous treatment (red squares), no significant difference was determined.

