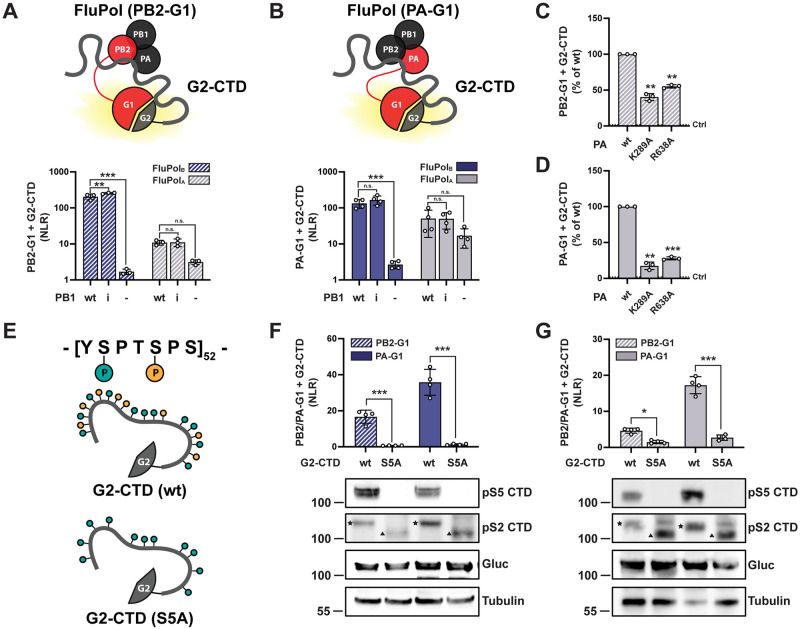
Fig 2. Gaussia princeps luciferase-based FluPol—CTD binding assay.
A-B. G2-CTD was expressed by transient transfection in HEK-293T cells together with PB2, PB1 and PA of FluPolB (B/Memphis/13/2003, blue bars) or FluPolA (A/WSN/1933, grey bars). Either PB2 (A, hatched bars) or PA (B, filled bars) were C-terminally tagged in frame with G1. As controls, the wild-type (wt) PB1 was replaced by the catalytic inactive PB1 D444A D445A mutant (i) or was omitted (-). Luciferase activities were measured in cell lysates at 24 hpt. Normalised luciferase ratios (NLRs) were calculated as described in the Materials and Methods section. The data shown are the mean ± SD of at least three independent experiments performed in technical triplicates. **p ≤ 0.002; ***p ≤ 0.001 (two-way ANOVA; Dunnett’s multiple comparisons test). C-D. The CTD binding of FluPolA mutants PA K289A and R638A was investigated. HEK-293T cells were transfected as described in (A) and (B), respectively. Relative Light Units (RLUs) are expressed as percentages relative to the FluPolA PA wt. The data shown are the mean ± SD of three independent experiments performed in technical triplicates. **p ≤ 0.002; ***p ≤ 0.001 (one-way ANOVA; Dunnett’s multiple comparisons test). The dotted line labelled “Ctrl” indicates the background signal i.e. the sum of the luminescence activities measured in control samples co-transfected with either the FluPol-G1 and G2 plasmids, or the G1 and G2-CTD plasmids. E. Schematic representation of the CTD constructs used in (F) and (G): the wild-type G2-CTD (wt, top) and the G2-CTD in which all serine 5 residues were replaced with an alanine (S5A, bottom). F-G. The interaction of the wt or the S5A mutated CTD to FluPolB (F) or FluPolA (G) was investigated by transient transfection in HEK-293T cells as described in (A-B). The data shown are the mean ± SD of four independent experiments performed in technical triplicates. *p ≤ 0.033; ***p ≤ 0.001 (two-way ANOVA; Sidak’s multiple comparisons test). In parallel, cell lysates were analysed by western blot using antibodies specific for the pS5 or pS2 CTD, G.princeps luciferase (Gluc) and tubulin. The slow- and fast-migrating bands detected with the pS2 CTD antibody, which likely correspond to the hyperphosphorylated and hypophosphorylated forms of the CTD, respectively, are indicated by a star and a triangle, respectively. The smeared signal in the G2-S5A-CTD samples likely corresponds to the detection of phosphorylation intermediates.

