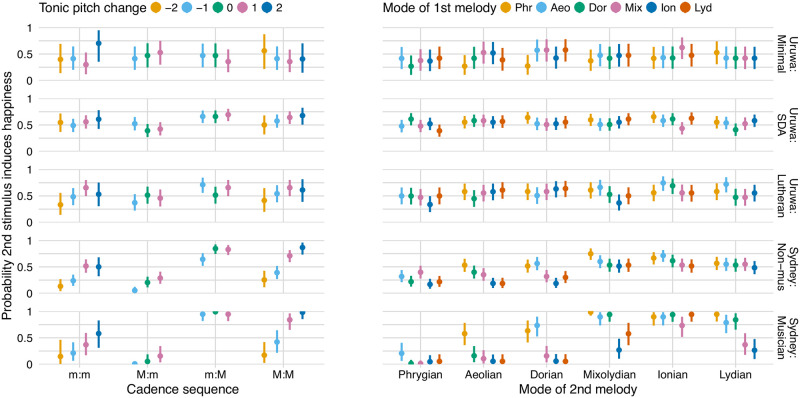
Fig 1. Visualizations of the effects of standard musicological categorizations across the five groups of participants.
For each pair of cadences, the effects produced by their cadence sequence and their tonics’ semitone pitch difference; e.g., a C minor cadence followed by a B♭ major cadence has the cadence sequence ‘m:M’ and a tonic pitch change of −2 semitones. For each pair of melodies, the effect of their mode sequence (the Phrygian mode has the lowest mean pitch followed by Æolian, followed by Dorian, and so forth, up to Lydian, which has the highest mean pitch). The bars show the descriptive models’ 95% credibility intervals.

