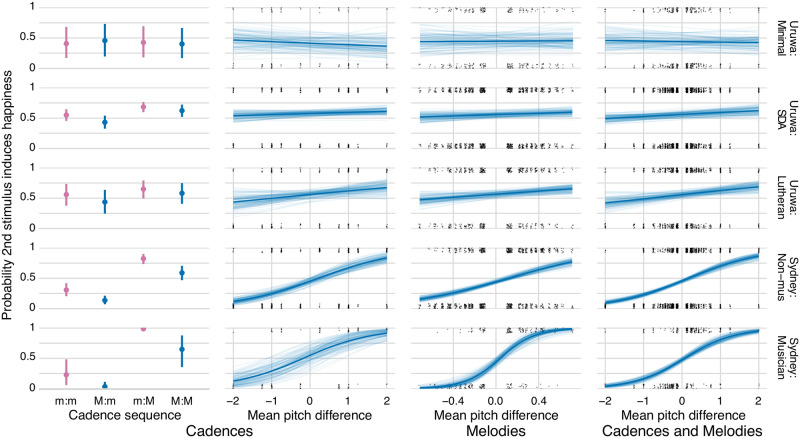
Fig 2. Visualizations of the models’ principal effects across the five groups of participants.
For cadences: (a) the effect of their cadence sequence, adjusted for their mean pitch difference and timbre (the difference between the inner two posterior distributions corresponds to H1); (b) the effect of their mean pitch difference (semitones), adjusted for their cadence sequence and timbre (H2). For melodies: (c) the effect of their mean pitch difference (semitones), adjusted for timbre and melodic subject (H3). For cadences and melodies: (d) the effect of their mean pitch difference (semitones), adjusted for timbre (H4). For each cadence sequence plot, the posterior mean and 95% credibility intervals are shown. For each mean pitch difference plot, the posterior mean slope is shown with the thick line, while its uncertainty is visualized with 100 samples from the posterior distribution. The grey dots, which have been spatially jittered, show the observed values.

