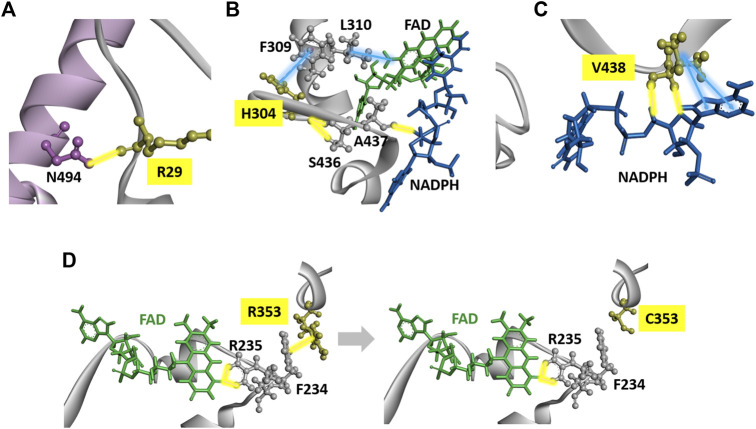
FIGURE 6.
DPD structural analysis. (A) Diagram of a fragment of the crystal structures of the H25R variant. The R25 residues are shown in yellow. (B) Diagram of a fragment of the crystal structures of the H304Y variant. The Y304 residues are shown in yellow. (C) Diagram of a fragment of the crystal structures of the F438V variant. The F438 residues are shown in yellow. (D) Diagrams of a fragment of the crystal structures of wild-type DPD (left panel) and R353C (right panel). The R353 and C353 residues are shown in yellow. Yellow and blue lines indicate hydrogen bonds and hydrophobic interactions, respectively.

