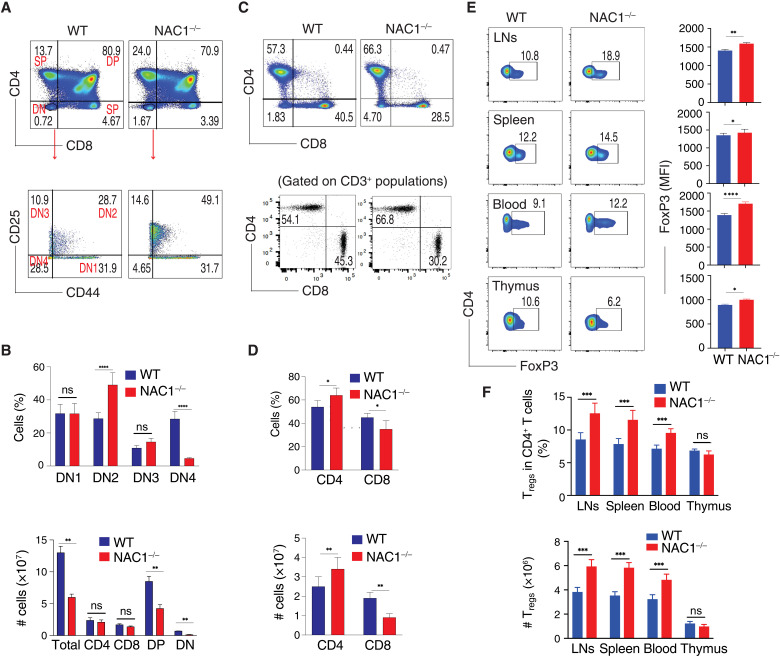
Fig. 1. Loss of NAC1 affects overall T cell populations.
T cells from the thymus, peripheral LNs, and spleen of WT or NAC1−/− mice were analyzed by flow cytometry and calculated for numbers or percentages. (A) CD4 and CD8 in the thymus. The DN populations were analyzed for DN1 to DN4 stages on the basis of CD44 and CD25. Data shown are the representative of five mice per group of three independent experiments. (B) Numbers and percentages of total thymocytes, CD4 or CD8 SP, and the percentages of DN2 or DN4 cells. Data shown are the representative of three identical experiments. The values represent means ± SD (N = 4 or 5). **P < 0.01, ****P < 0.0001, ns, no difference, Student’s unpaired t test. (C) CD4 and CD8 T cells from the pooled LNs and spleen. Data shown are the representative of five mice per group of three independent experiments. (D) Numbers and percentages of T cells from the pooled LNs and spleen. *P < 0.05, **P < 0.01. (E) Representative CD4+FoxP3+ Tregs in the pooled LNs, spleen, blood, and thymus, gating on CD4+ populations. Data shown are the representative of three identical experiments (N = 4 or 5). *P < 0.05, **P < 0.01, ****P < 0.0001. (F) Numbers and percentages of Tregs. Data shown are the representative of three identical experiments. The values represent the means ± SD (N = 4 or 5). ***P < 0.001; ns, no statistical difference, Student’s unpaired t test.

