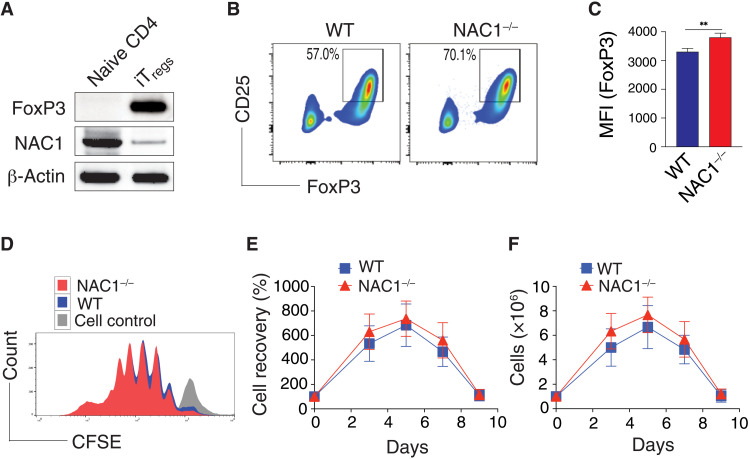
Fig. 2. Loss of NAC1 enhances the induction of iTregs but not cell division and survival.
The naive CD4+CD25− T cells from the pooled spleen and LNs of WT or NAC1−/− mice were induced to iTregs in vitro in the presence of TGF-β for 5 days (A to C), or purified CD4+ Tregs from the pooled LNs and spleen of WT or NAC1−/− mice were stimulated with anti-CD3 plus CD28 antibodies in the presence of rIL-2 for various times (D to F). (A) Expression of NAC1 in naïve CD4 and iTregs of WT T cells detected by immunoblots. (B) Expression of CD25 and FoxP3 in iTregs generated from WT and NAC1−/− CD4+CD25− T cells by flow cytometry. Data shown are the representative of three identical experiments. (C) MFI of FoxP3 in iTregs generated from WT and NAC1−/− CD4+CD25− T cells as analyzed by flow cytometry. Results shown are the means ± SD of three identical experiments. **P < 0.01, Student’s unpaired t test. (D) Cell proliferation/division by carboxyfluorescein diacetate succinimidyl ester (CFSE)–based flow cytometry. Data shown are the representative of three identical experiments. (E) Percentage and (F) numbers of cell recovery on various days were examined by trypan blue exclusion. The numbers of T cells present on day 0 were assigned a value of 100%, and numbers surviving on various days were used to calculate the percentage recovery relative to day 0. Data shown represent the means ± SEM of percentage change or numbers of three independent experiments. All P > 0.05, Student’s unpaired t test.

