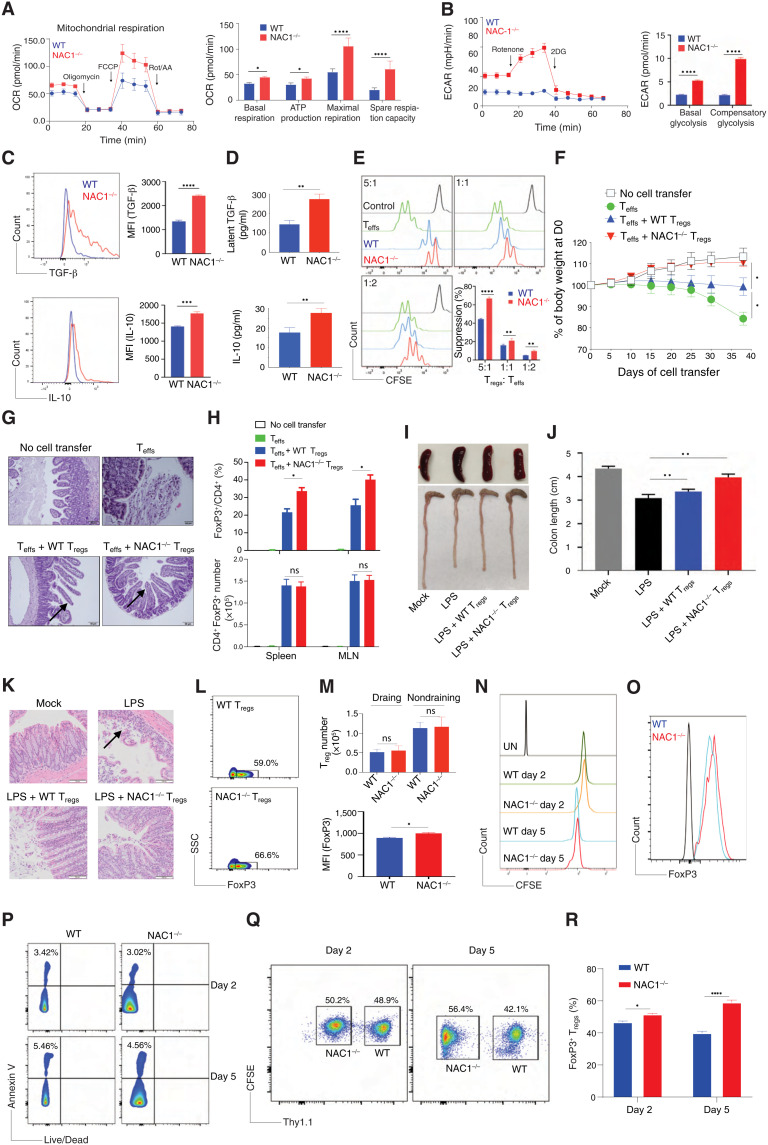
Fig. 3. Loss of NAC1 enhances the functional activity of Tregs.
Purified CD4+ Tregs from the pooled LNs and spleen of WT or NAC1−/− mice were stimulated with anti-CD3 plus CD28 antibodies in the presence of rIL-2 for various times. (A) OCR. (B) ECAR. (C) Cytokine production by intracellular staining. (D) Cytokine secretion by ELISA. (E) In vitro suppressive assay. (F to I) T cell transfer model of colitis. (F) Changes of body weight. (G) Representative hematoxylin and eosin (H&E)–stained sections of gut tissues. (H) Treg frequencies/numbers in the adoptive transfer–induced colitis model. (I and J to M) Lipopolysaccharide (LPS)–mediated colitis. (I) Representative colon images of the LPS-induced colitis. (J) Colon lengths in LPS-induced colitis. (K) Representative H&E-stained sections of images of proximal colon cross section. (L and M) Numbers of transferred Tregs and FoxP3 MFI (bottom), gating on Thy1.2+ populations (top). (N to P) In vivo analyses of Tregs. WT and NAC1−/− Tregs (Thy1.2+) were labeled with CFSE and intravenously injected into mice. On days 2 and 5, the transferred Th1.2+ Tregs were analyzed by flow cytometry. (N) Proliferation by CFSE. (M) FoxP3 expression. (P) Apoptosis. (Q and R) In vivo cotransfer of CFSE-labeled WT (Thy1.1+) and NAC1−/− (Thy1.2+) at 1:1 ratio into recipients and examined the NAC1−/−/WT ratios of Tregs on days 2 and 5. Data shown are the means ± SD of three independent experiments and are the representative of three identical experiments. *P < 0.05, **P < 0.01, ***P < 0.001, ****P < 0.0001, Student’s unpaired t test.

