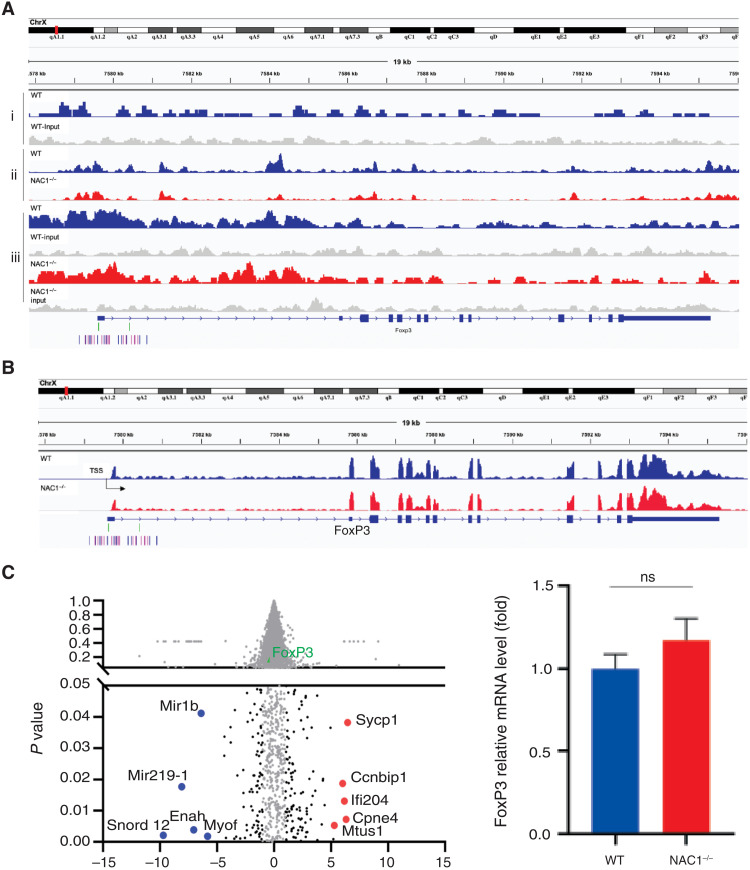
Fig. 6. Combined analyses of ChIP-seq, ATAC-seq, and RNA sequencing indicate that FoxP3 transcription is not regulated by NAC1.
(Ai) NAC1 ChIP-seq. Approximately 100 differential peaks (NAC1 versus input) were identified using HOMER. NAC1 peak density was not enriched within the regulatory elements of FoxP3. The genes targeted by NAC1-enriched islands in WT Tregs were presented. Representative genomic regions (promotor and CNS1-3) show NAC1 enrichment. Normalized ChIP-seq reads (bigWig) and enriched islands (bed) are shown. (Aii) ATAC-seq. Differential accessibility at the FoxP3 gene locus in WT Tregs compared with NAC1−/− Tregs is presented. There were more than 10,000 differential ATAC-seq peaks in total, but there were not any significant differential accessibility at the FoxP3 gene locus in WT Tregs as compared with NAC1−/− Tregs. (Aiii) FoxP3 ChIP-seq. The genes targeted by FoxP3-enriched islands in WT or NAC1−/− Tregs are presented. (B) RNA sequencing. FoxP3 was not differentially expressed in NAC1−/− Tregs among ~200 differentially expressed genes, i.e., FoxP3 gene was identically expressed in WT Tregs and NAC1−/− Tregs. (C) Volcano plot (left) and summarized mRNA change between WT and NAC1−/− Tregs (right). Black dots represent the significant changed genes (log2 fold change >2, P < 0.05). Red dots represent the top 5 up-regulated genes in NAC1−/− Tregs, and blue dots represent the top 5 down-regulated genes in NAC1−/− Tregs compared to the WT. FoxP3 was marked as a green dot. All results shown are the representative of three identical experiments.

