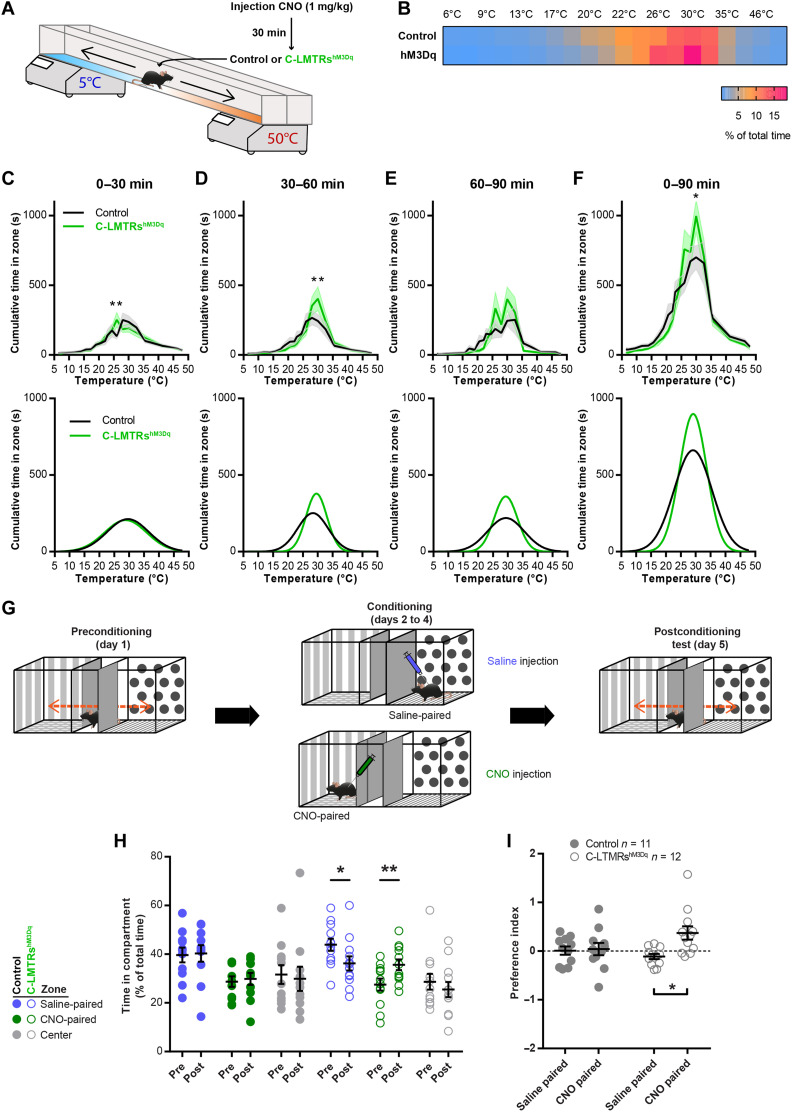
Fig. 4. C-LTMR exogenous activation increases thermal preference and induced conditioned place preference.
(A) Thermal gradient protocol to assess thermotaxis of control (Nav1.8Cre; AAVPHPs-CAG-mCherry; in black) and C-LTMRshM3Dq (Nav1.8Cre; AAVPHPs-pCav3.2-FLEx-HA-hM3Dq; in green) mice. (B) Heatmap of the zone occupancy (in % or total time) in the thermal gradient for 90 min after CNO injection. (C) Top: Cumulative time in the thermal gradient zones during the first 30 min after CNO injection. Bottom: Predictive curves based on a Gaussian fit of the results. (D) Top: Cumulative time in the thermal gradient zones between 30 and 60 min after CNO injection. Bottom: Predictive curves based on a Gaussian fit of the results. (E) Top: Cumulative time in the thermal gradient zones between 60 and 90 min after CNO injection. Bottom: Predictive curves based on a Gaussian fit of the results. (F) Top: Cumulative time in the thermal gradient zones for the entire 90 min after CNO injection. Bottom: Predictive curves based on a Gaussian fit of the results. Statistics performed: two-way ANOVA, Bonferroni post hoc test, **P = 0.0037 (C); **P = 0.0019 (D); *P = 0.0112 (F); control, n = 11 and C-LTMRshM3Dq, n = 12. (G) Conditioned place preference protocol. (H) Time spent in compartments before (pre-) and after (post-) 3 days of conditioning. For each condition: two-way repeated-measures (RM) ANOVA, Sidak post hoc test [**P = 0.0098; *P = 0.0143; control (n = 11) and C-LTMRshM3Dq (n = 12)]. (I) C-LTMRshM3Dq preferred the compartment in which they received CNO, while no preference was observed in control mice. Conditioned place preference index [(time post − time pre)/time pre], two-way RM ANOVA, Bonferroni post hoc test (*P = 0.0141).

