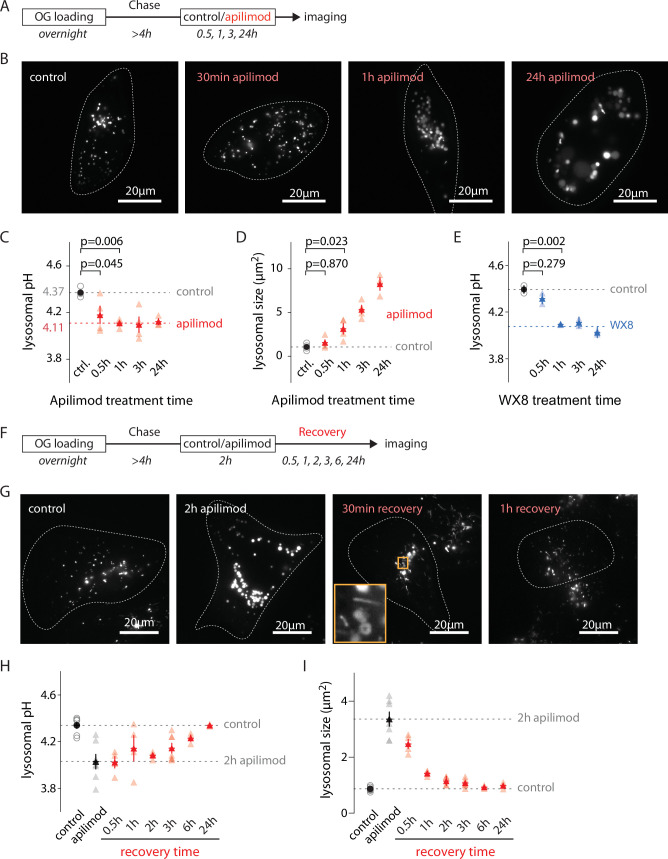
Figure 2. Evolution of lysosomal pH and size during PIKfyve inhibition and recovery.
(A) Protocol timeline to analyze the evolution of lysosomal pH and size during PIKfyve inhibition. U2OS cells were ‘lysosome-loaded’ with Oregon Green 488-dextran (OG) then treated for 30 min, 1 hr, 3 hr, or 24 hr with apilimod (100 nM, red) or its vehicle (0.25% DMSO, control) before imaging. (B) Representative images of cells acquired by 445 nm laser excitation. Bright objects represent OG-positive lysosomes. Dotted lines delineate cell outlines. (C, D) Comparison of lysosomal pH (C) and size (D) in control (gray empty circle) and after different apilimod treatment times (red triangle). Each symbol represents the averaged lysosomal pH of one experiment (four independent experiments, 10–15 cells per condition per experiment). Red dashed line in (C) represents the average pH value of 1–24 hr apilimod time points. p-Values were obtained from one-way ANOVA Dunnett’s multiple-comparisons test. (E) Comparison of lysosomal pH in control condition (gray empty circle) and after different treatment times with the PIKfyve inhibitor WX8 (1 µM, blue triangle). Each symbol represents the averaged lysosomal pH of one experiment (two experiments, 10–13 cells per condition per experiment). Blue dashed line represents the average value of 1–24 hr WX8 time points. (F) Protocol timeline to analyze the recovery of lysosomal pH and size after washout of apilimod. U2OS cells were ‘lysosome-loaded’ with OG, treated 2 hr with 100 nM apilimod or its vehicle (0.25% DMSO, control) to induce lysosomal hyperacidification and swelling. Apilimod was subsequently washed out with fresh media and imaged 30 min, 1 hr, 3 hr, 6 hr, and 24 hr after the washout. (G) Representative images of cells acquired using 445 nm laser excitation. Bright objects represent OG-positive lysosomes. Dotted lines delineate cell outlines. The orange box at 30 min time point highlights lysosomal tubulation events. (H, I) Comparison of lysosomal pH (H) and size (I) in control condition (gray empty circle), after 2 hr apilimod treatment (black triangle) and at different times after apilimod washout (red triangle). Each symbol represents the average lysosomal pH of one experiment (3–7 experiments, 8–15 cells per condition per experiment).


