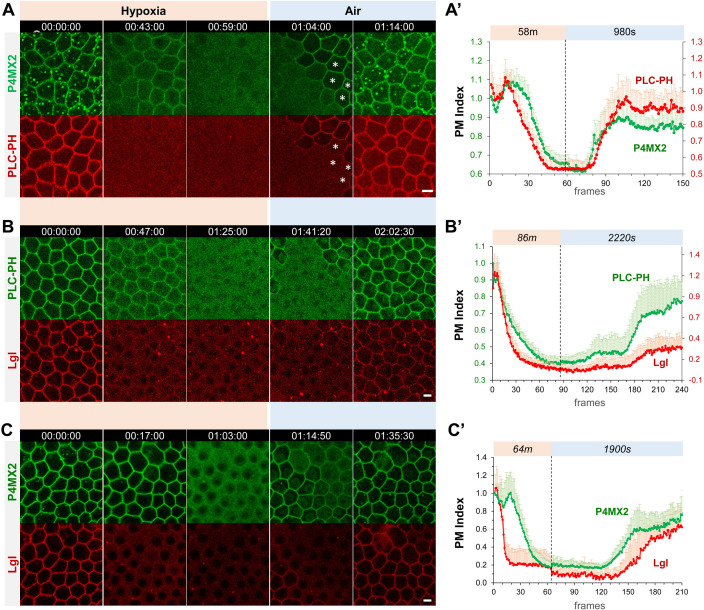
Figure 1. Hypoxia induces acute and reversible loss of P4M × 2::GFP and PLC-PH::RFP from the PM in Drosophila follicle cells.
(A–C) Representative frames showing follicle cells coexpressing P4M × 2::GFP and PLC-PH::RFP (A) or P4M × 2::GFP and Lgl::RFP (B) or PLC-PH::GFP and Lgl::RFP (C) undergoing hypoxia and reoxygenation. In A, at 1:04:00, asterisks (*) highlight cells that had already recovered P4M × 2::GFP but not PLC-PH::RFP. (A’–C’) Quantification of PM localizations of P4M × 2::GFP and PLC-PH::RFP (A’, n=18, 18, Figure 1—source data 1) or P4M × 2::GFP and Lgl::RFP (B’, n=20, 20, Figure 1—source data 2) or PLC-PH::GFP and Lgl::RFP (C’, n=20, 20, Figure 1—source data 3) during hypoxia and reoxygenation. PM Index: ratio of mean intensity of PM and cytosolic signals, normalized by the average value of the first three frames. Time stamp in hr:min:sec format. Scale bars: 5 µm.

