Figure 3.
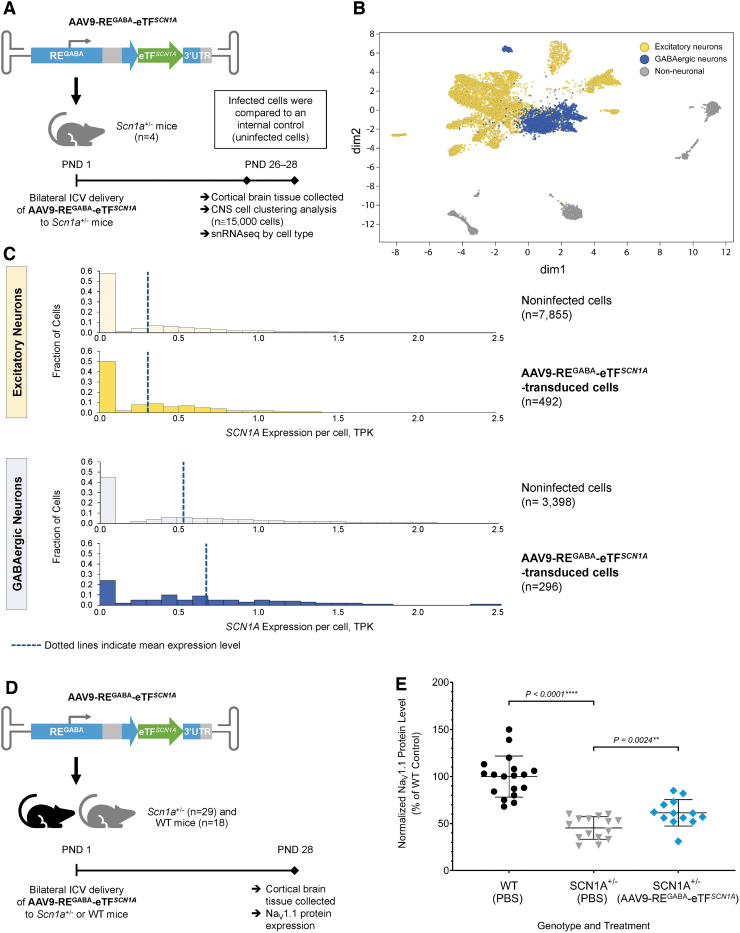
AAV9-REGABA-eTFSCN1A upregulates SCN1A within GABAergic inhibitory interneurons in vivo. (A) Experimental design to evaluate SCN1A expression in excitatory and GABAergic inhibitory neurons. Four Scn1a+/− mice were treated with 1.7E10 vg per animal of AAV9-REGABA-eTFSCN1A on PND1 via bilateral ICV injection. On PND28, cortical brain tissue was collected, and clustering analysis was performed to classify over 15,000 cells into excitatory and inhibitory cell types based on transcriptome profiles. (B) Clustering of CNS cell types in cortical brain tissue. Gene expression visualization using tSNE to compute a low-dimensional representation of snRNAseq data; dim2 and dim1 are the outputs of tSNE, the 2D representation of the gene expression profiles of each cell. Yellow dots denote excitatory neurons; blue dots denote GABAergic inhibitory neurons; gray dots denote non-neuronal cells. (C) SCN1A mRNA transcript levels in excitatory and GABAergic inhibitory neurons. AAV9-REGABA-eTFSCN1A upregulates SCN1A mRNA specifically in GABAergic inhibitory neurons, with no upregulation in excitatory neurons. Dotted lines indicate mean SCN1A TPK per cell. (D) Experimental design to determine NaV1.1 protein expression. One-day-old (PND1) Scn1a+/− mice were administered PBS (n = 16) or 5.1E10 vg per animal AAV9-REGABA-eTFSCN1A (n = 13) and 18 WT littermates were administered PBS via a bilateral ICV injection. Animals were sacrificed on PND28 and brain tissue was evaluated by MSD electrochemiluminescence-based sandwich immunoassay. (E) NaV1.1 protein expression. Membrane-associated NaV1.1 protein levels from PBS-treated WT (6 males/12 females; black circle) or Scn1a+/− mice (7 males/9 females; gray triangle) and AAV9-REGABA-eTFSCN1A-treated Scn1a+/− mice (9 males/4 females; blue diamond). Mean levels ± SD are indicated; ****p < 0.0001 and **p = 0.0024, Mann–Whitney test. CNS, central nervous system; dim, dimension; MSD, Meso Scale Discovery; NaV1.1, voltage-gated type I sodium channel; PBS, phosphate-buffered saline; snRNAseq, single-nucleus RNA sequencing analysis; TPK, transcripts per 1000 total transcripts; tSNE, t-distributed stochastic neighbor embedding; WT, wild-type.

