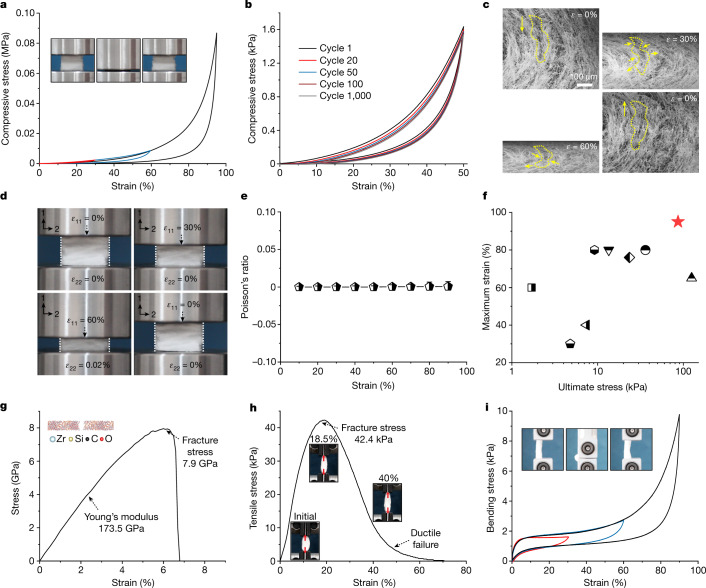
Fig. 3. Mechanical properties of hypocrystalline ZAGs.
a, Uniaxial compression of ZAGs with strain up to 95%. The red, blue and black curves represent compressive strain of 30%, 60% and 95%, respectively. Inset: experimental snapshots of one compression cycle. b, The compressive stress–strain curves of ZAGs at 50% strain for 1,000 cycles. c, In situ SEM images of ZAGs under uniaxial compression. ε is the in situ compressive strain. d, Experimental snapshots of the near-zero ν behaviour of ZAGs under uniaxial compression. e, The near-zero ν of ZAGs under different compressive strains. Standard deviations of ν are shown as error bars. f, The maximum compressive strain and ultimate stress of ZAGs compared with other ceramic nanofibrous aerogels. Red pentagram, ZAGs in this work; square, Si3N4 nanobelt11; pentagon, oxide ceramic fibre12; bottom triangle, Al2O3 nanotube31; hexagon, SiO2 fibre with SiO2 nanoparticles10; upside-down triangle, SiO2–Al2O3 fibre26; diamond, SiC nanowire40; circle, PAN/BA-a and SiO2 fibre14; right-side-up triangle, BN nanotube18. g, The stress–strain curve from the MetaD simulation of the single nanofibre under uniaxial tension. Inset: fracture simulation of single fibre. h, The tensile stress–strain curve of ZAGs. Inset: experimental snapshots of tensile fracture. i, The bending test of ZAGs with strain up to 90%. The red, blue and black curves represent bending strain of 30%, 60% and 90%, respectively. Inset: experimental snapshots of the bending experiment.

