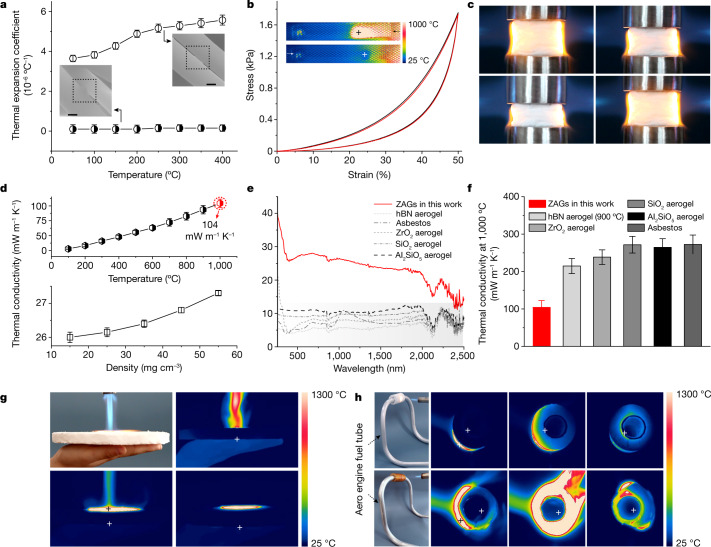
Fig. 4. Thermal stability and thermal insulation properties of ZAGs.
a, The near-zero α (black circle) of ZAGs compared with the positive α (white circle) under different temperatures. Inset: the corresponding SEM images of crosslinking state among nanofibres. Error bars indicate standard deviations of α. Scale bars = 200 nm. b, The strain and stress evolution after 10,000 cycles of sharp thermal shocks (200 °C s−1). The black and red curves represent the mechanical performance (50% compressive strain) after the 1st and 10,000th cycles of thermal shocks. Inset: infrared images of ZAGs in one thermal shock cycle. c, Compression and recovery process under 50% compressive strain of the ZAGs in the bilateral flame of a butane blowtorch. d, Thermal conductivity of ZAGs as a function of temperature (top) and density (bottom) (steady-state thermal measurement in air). The red data highlights an ultralow κ of only 104 mW m−1 K−1 at 1,000 °C. e, Infrared radiation absorption spectra of zircon, hBN, ZrO2, SiO2 and Al2SiO5 aerogels, and asbestos. f, Thermal conductivity at 1,000 °C of zircon, hBN, ZrO2, SiO2 and Al2SiO5 aerogels, and asbestos. The hBN aerogel was tested at 900 °C. Error bars in d, f indicate the standard deviations of κ. g, Photograph and infrared images of ZAGs for thermal protection for the human body under a butane blowtorch. h, Comparison of thermal insulation performance between ZAGs and a commercial barrier (thickness about 1 cm) for an aero engine (CFM56) fuel tube under the flame of a butane blowtorch. Torch heating started at 0 min and stopped at 5 min, showing only 33 °C inside a fuel tube with a stable ZAG barrier (top) compared with 267 °C in one with a burn-down commercial barrier (bottom).

