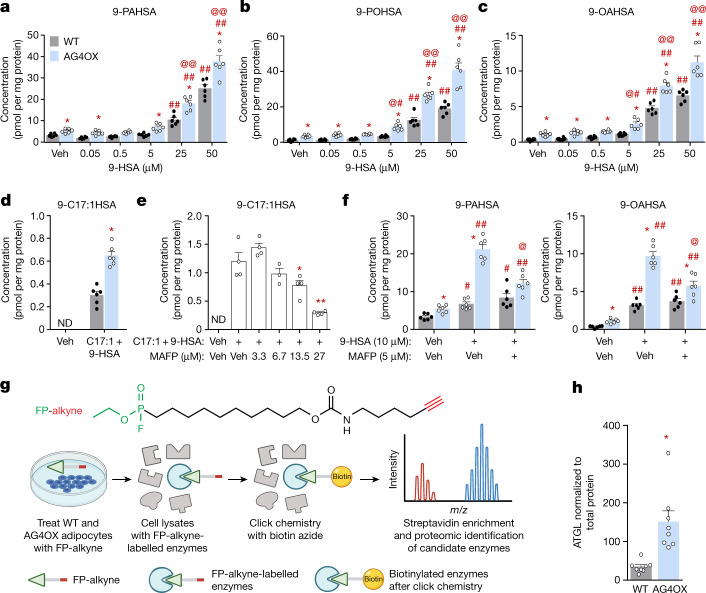
Fig. 1. FAHFA biosynthesis is increased in AG4OX SVF adipocytes and is sensitive to fluorophosphonate inhibitors.
a–d, Biosynthesis of 9-PAHSA (a), 9-POHSA (b), 9-OAHSA (c) and 9-C17:1HSA (d) in WT and AG4OX SVF adipocytes incubated with 0.1% DMSO (vehicle (Veh)), increasing concentrations of 9-HSA (a–c) or both C17:1 and 9-HSA (25 µM, each) (d). n = 6 wells per condition with cells pooled from 9 mice per genotype; mean ± s.e.m. *P < 0.003 versus WT, same treatment (t-test correcting for Holm–Sidak multiple comparisons). #P < 0.05, ###P < 0.0001 versus vehicle, same genotype, @P < 0.05, @@P < 0.0001 versus WT, same treatment (two-way analysis of variance (ANOVA)). ND, not detected. e, 9-C17:1HSA biosynthesis in 3T3-L1 adipocytes pre-incubated with the indicated concentrations of MAFP or 0.1% DMSO (Veh) for 1 h, and then co-incubated with C17:1 and 9-HSA (10 µM each) or 0.1% DMSO (Veh) for 2 h. n = 4 wells except for MAFP 6.75 µM group n = 3; mean ± s.e.m. *P < 0.05, **P < 0.0001 versus C17:1 and 9-HSA alone (one-way ANOVA). f, Biosynthesis of 9-PAHSA (left) and 9-OAHSA (right) in WT and AG4OX SVF adipocytes pre-incubated with MAFP or 0.1% DMSO for 1 h, and then co-incubated with 9-HSA (10 µM) or 0.1% DMSO (Veh) for 2 h. n = 6 wells per condition; mean ± s.e.m. *P < 0.003 versus WT, same treatment (t-test correcting for Holm–Sidak multiple comparisons). #P < 0.05, ##P < 0.0001 versus Veh, @P < 0.0001 versus 9-HSA alone, same genotype (two-way ANOVA). g, Structure of FP-alkyne (top) and schematic diagram of activity-based proteomics (bottom). Created with BioRender.com. h, ATGL protein levels in AG4OX SQ WAT, normalized to total protein between 37–25 kDa on western blot. n = 8 mice, mean ± s.e.m. *P < 0.0012 versus WT (t-test, two-tailed). Similar results were obtained in at least two independent experiments. See also Extended Data Fig. 1.

