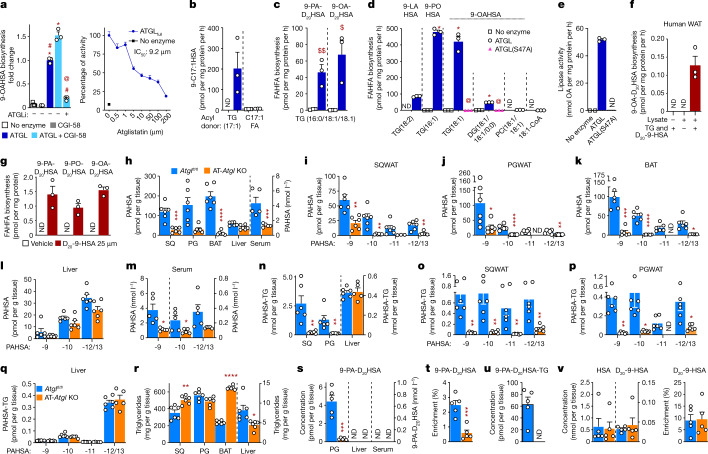
Fig. 3. ATGL transacylation activity synthesizes FAHFAs in vitro and in vivo.
a, Left, biosynthesis of 9-OAHSA in vitro by affinity-purified WT ATGL-288 (ATGL) and the cofactor CGI-58 from 9-HSA and acyl-donor TG(18:1) and inhibition with atglistatin (50 µM). Right, inhibition of the transacylation activity of affinity-purified full-length ATGL (ATGLfull) by the indicated doses of atglistatin. b, c, WT ATGL-288 catalysed biosynthesis of 9-C17:1HSA from 9-HSA and acyl donors TG(C17:1) and C17:1(FFA) (b) and biosynthesis of 9-PA-D20HSA and 9-OA-D20HSA from D20-9-HSA and acyl donor TG(C16:0/18:1/18:1) (c). d, WT ATGL-288 and ATGL-288(S47A) transacylation activity catalysed 9-FAHFA biosynthesis from acyl donors: TG(18:2), TG(16:1), TG(18:1), DG(C18:1/18:1/0:0), phosphatidylcholine (PC(18:1/18:1/0:0)) and 18:1-CoA. e, Lipase activity of WT ATGL-288 (ATGL) and ATGL-288(S47A) enzymes as measured by OA release during the FAHFA biosynthesis assay with the substrate TG(18:1) in d. f, 9-OAHSA biosynthesis from TG(18:1) and D20-9-HSA in human SQ WAT lysates. g, 9-FAHFA biosynthesis in human SVF adipocytes incubated with D20-9-HSA or vehicle (0.025% DMSO). (n = 3, mean ± s.e.m. a–g), *P < 0.0001 versus no enzyme, #P < 0.0001 versus ATGL/CGI-58 and @P < 0.0001 versus ATGL (one-way ANOVA, a, d). $P < 0.02, $$P < 0.008 versus no enzyme (t-test, two-tailed c). AT-Atgl-KO and littermate Atglfl/fl female mice were used for h–v. h–k, Total endogenous PAHSA (h) and PAHSA isomer levels in SQ WAT (i), PG WAT (j), BAT (k), liver (l) and serum (m). n–q, Total TG-esterified PAHSA (n) and TG-esterified PAHSA isomer levels in SQ WAT (o), PG WAT (p) and liver (q). r, Adipose tissue and liver total triglyceride levels. AT-Atgl-KO and Atglfl/fl mice were injected with D20-9-HSA (5 mg kg−1) intraperitoneally and euthanized 4 h later (s–v). s, PG WAT, liver and serum levels of newly synthesized 9-PA-D20HSA. t–v, 9-PA-D20HSA enrichment (9-PA-D20HSA per cent of total 9-PAHSA) (t), levels of newly synthesized TG-esterified 9-PA-D20HSA (u), endogenous HSA substrate level (v, left) and enrichment of D20-9-HSA (v, right) in PG WAT. n = 6 mice for all tissues in h–r; n = 5 mice for serum in h, m and s–v; mean ± s.e.m. *P < 0.05, **P < 0.01, ***P < 0.001, ****P < 0.0001 versus Atglfl/fl mice t-test, two-tailed (h–v). White error bars are shown within the bars in o, p. Only levels above the quantification limit are shown with white circles.

