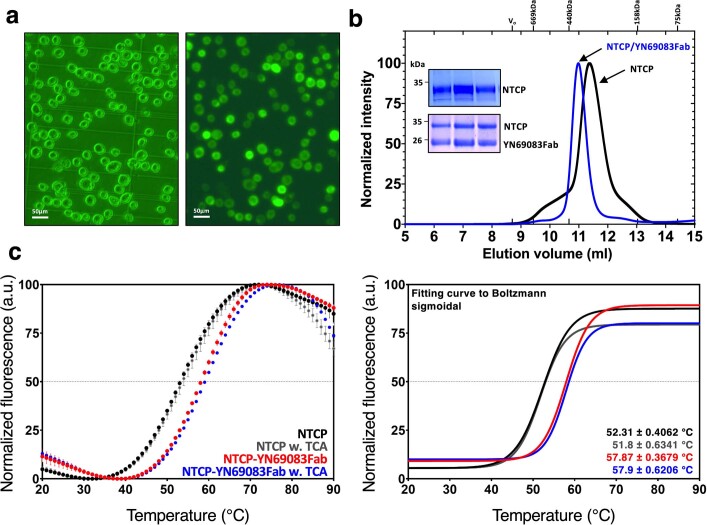
Extended Data Fig. 2. Expression, purification, and biochemical characterization of NTCP and complex with Fab(YN69083).
a, Phase contrast (left) and fluorescence microscopy image (right) of Sf9 cells expressing NTCP-GFP. Fluorescence indicates level of NTCP-GFP expression. Similar results were obtained in five separate experiments. b, Representative size-exclusion chromatography profile of NTCP (black line) and complex with Fab (blue line). Inset shows SDS–PAGE gel of NTCP and complex with Fab used for cryo-EM grid preparation. SDS-PAGE gels were visualized by Coomassie-blue staining. c, DSF thermal stability assay of NTCP, and NTCP-Fab complex with or without 50 µM TCA. Raw data were plotted with error bars indicating the standard deviations of double samples (left). The T m values were calculated as a graph fitted to the Boltzmann sigmodal equation (right). Binding of one Fab fragment to NTCP show a strong antibody dependent stabilisation of NTCP, raising the melting point from 52.3 ± 0.4 °C to 57.9 ± 0.4 °C.

