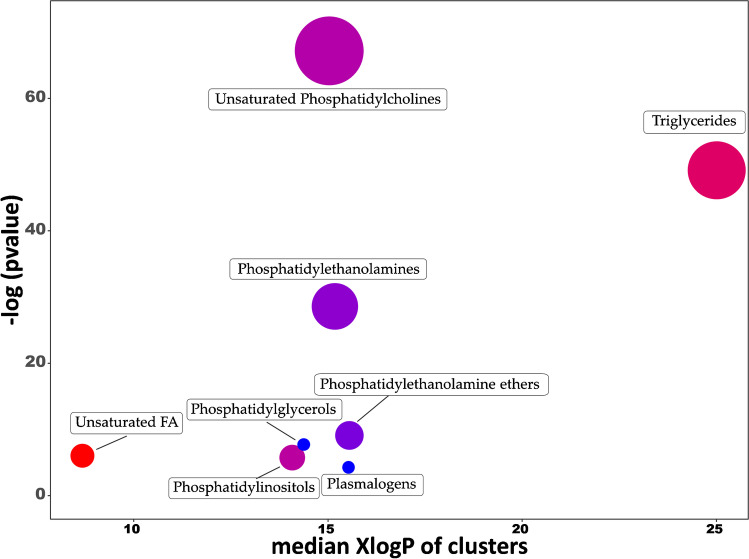
Fig. 3.
Chemical similarity enrichment analysis of metabolomics data from SH-SY5Y cells treated with D. salina (DS) extract at 20 μg/mL (n = 5) compared to control conditions (0.4% ethanol v/v) for 24 h (n = 5). Statistical enrichment analysis utilized chemical similarity and ontology mapping to generate metabolite clusters. The y-axis shows most significantly altered clusters on top; x-axis shows XlogP values of lipid clusters. Cluster colors give the proportion of increased or decreased compounds (red = increased, blue = decreased) in each cluster. Chemical enrichment statistics is calculated by Kolmogorov–Smirnov test. Only enrichment clusters are shown that are significantly different at p < 0.05. Plots and calculations were done using ChemRICH

