
Fig. 10.
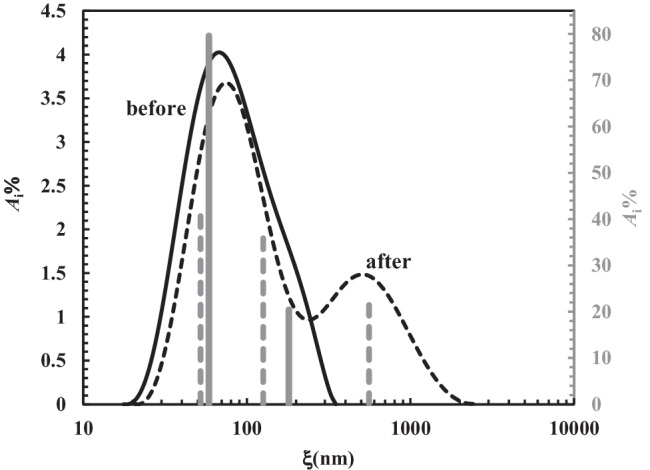
Comparison between the continuous mesh size distribution before (solid black curve) and after (dashed black line) chest physiotherapy referring to samples 11 (see Table 1). Solid grey vertical lines (secondary vertical axis on the right) indicate the discrete mesh size distribution referring the solid black curve. Dashed grey vertical lines (secondary vertical axis on the right) indicate the discrete mesh size distribution referring the dashed black curve