
Fig. 4.
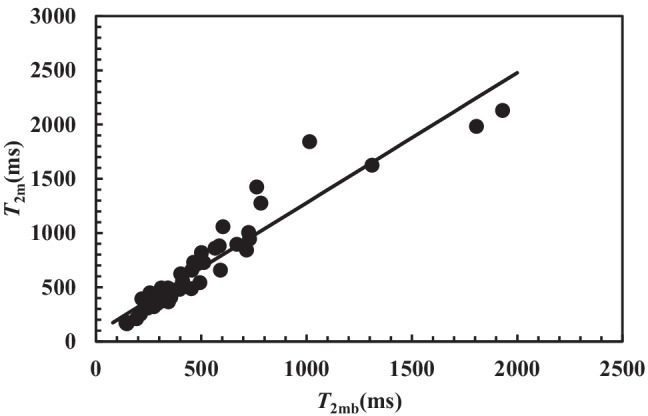
Statistically significant correlation between T2m and T2mb referring to all the 42 samples considered (rsp = 0.97, p < 0.0001). Solid line represents the linear interpolant: T2m(ms) = (1.2 ± 0.06) × T2mb + (78 ± 41)
Official websites use .gov
A
.gov website belongs to an official
government organization in the United States.
Secure .gov websites use HTTPS
A lock (
) or https:// means you've safely
connected to the .gov website. Share sensitive
information only on official, secure websites.
Statistically significant correlation between T2m and T2mb referring to all the 42 samples considered (rsp = 0.97, p < 0.0001). Solid line represents the linear interpolant: T2m(ms) = (1.2 ± 0.06) × T2mb + (78 ± 41)