
Fig. 5.
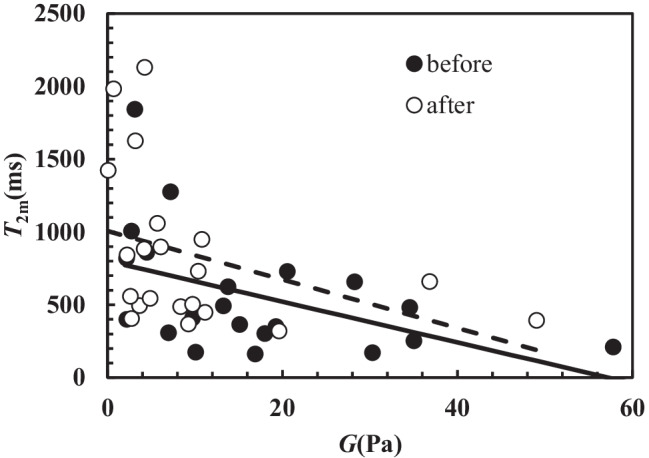
Correlation between T2m and G. Dark circles indicate samples before chest physiotherapy, while white circles refer to samples after chest physiotherapy. A statistically significant correlation between T2m and G occurs both before (rsp = −0.53, p = 0.014; T2m(ms) = −(14.0 ± 6.0) × G(Pa) + (801 ± 131); solid line) and after (rsp = −0.495, p = 0.023; T2m(ms) = −(14.6 ± 9.3) × G(Pa) + (1006 ± 143); dashed line) chest physiotherapy. The overall correlation is statistically significant (rsp = −0.58, p = 0.0001; T2m(ms) = −(16.8 ± 5.2) × G(Pa) + (928 ± 97))