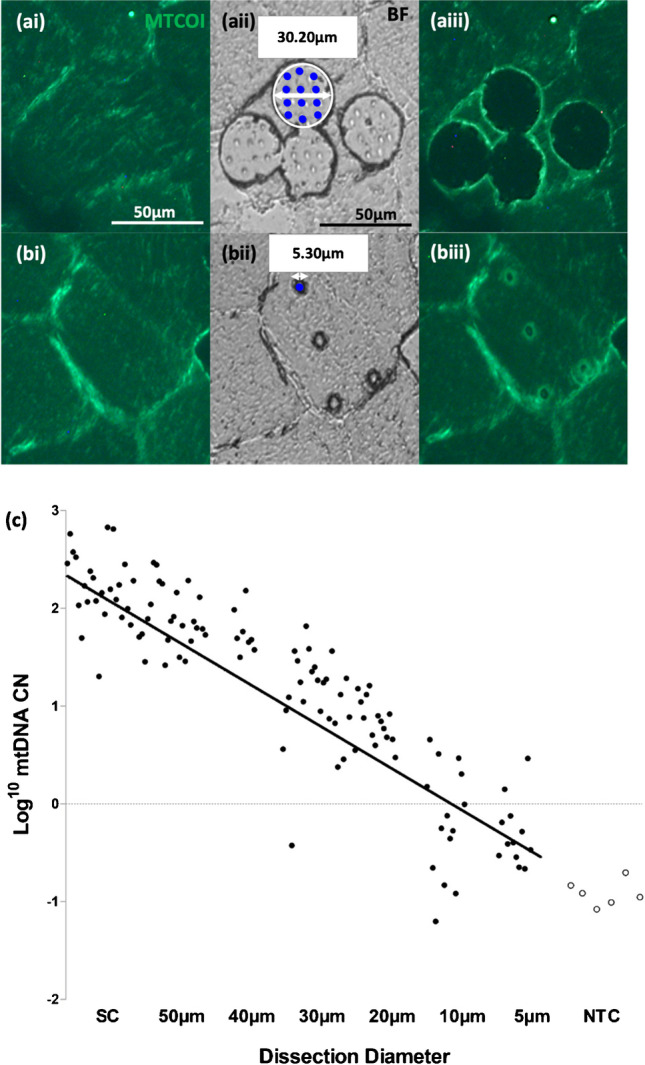
Fig. 2.

Working limit of LCM. Panels (a) and (b) correspond to biopsies taken using LCM with dissection diameters of 30 µm (a) and 5 µm (b), respectively. The first two panels (left to right) correspond to pre-biopsy immunofluorescent (IF) images used to identify the area of interest (ai, bi). The middle panels show the BF post-cut images with the delineated cutting area outlined in white (aii) and laser pulse markers, shown as blue dots (aii, bii). The right panels correspond to post-dissection IF images showing the indentations made by the cutting laser and laser pulses and the relative change in fluorescence indicating successful isolation of tissue (aiii, biii). CN/µl values (log transformed, y-axis) were plotted against LCM dissection size (µm). Regression analysis demonstrated a significant relationship between LCM dissection size and CN/µl (n = 14; Spearman correlation = 0.91, p < 0.05). A greater proportion of dissections under 20 µm in diameter corresponded to less than 1 mtDNA copies (< 0 log transformed CN/µl), compared with dissections larger than 20 µm (c). All dissections taken corresponded to their labelled diameter ± 10%, except 5 µm (± 20%). All data points in black correspond to technical triplicates of lysate samples taken using LCM. All data points in white correspond to technical triplicates of non-template controls.
