Fig. 5.
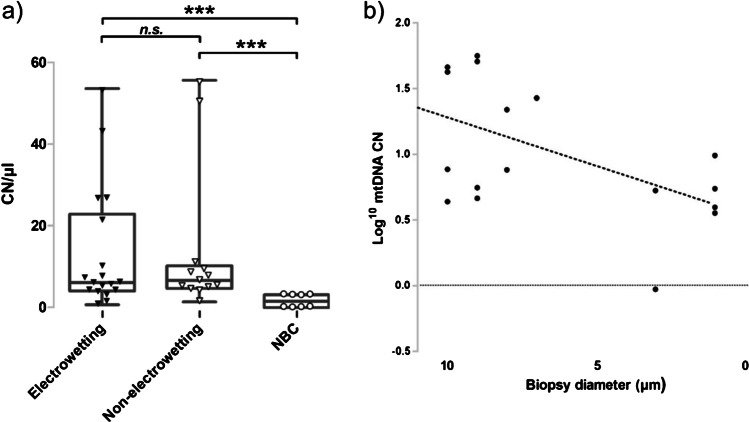
qPCR analysis of the biopsied samples. (a) Each data point corresponds a technical triplicate of each biopsy lysate sample. The box plot corresponds to the median and interquartile range of the data points. Data points shown as black triangles correspond to biopsies obtained with electrowetting (n = 11; mean = 13.25; median = 6.23) and points depicted as white triangles correspond to non-electrowetting (n = 7; mean = 13.55; median = 6.77). Points depicted as white dots correspond to non-biopsy controls (NBC; n = 5; mean = 1.71; median = 1.71). A significant difference in CN/µl was observed between biopsies acquired with (electrowetting: p = 0.0009 < 0.001, Mann–Whitney U test) and without electrowetting (non-electrowetting: p = 0.0006 < 0.001, Mann–Whitney U test) compared with NBCs. There was no significant difference in CN/µl observed between biopsies acquired with electrowetting and non-electrowetting (p = 0.76, Mann–Whitney U test). If potential outliers within the non-electrowetting group are removed (n = 6; mean = 6.40; median = 5.53), then a significant difference was still observed between non-electrowetting biopsies and NBCs (p < 0.01, Mann–Whitney U test). There was also no significant difference between the medians of electrowetting and non-electrowetting biopsy groups (p = 0.70, Mann–Whitney U test). (b) The CN/µl of biopsies (log transformed, y-axis) was plotted against biopsy diameter as determined from topographical scans of the biopsy site. The mean micropipette biopsy site diameter was 6.4 µm. Biopsy site diameter and CN/µl value were highly variable and a positive correlation that did not reach significance was observed between biopsy diameter and CN/µl value (n = 11, r = 0.436, p > 0.05)

