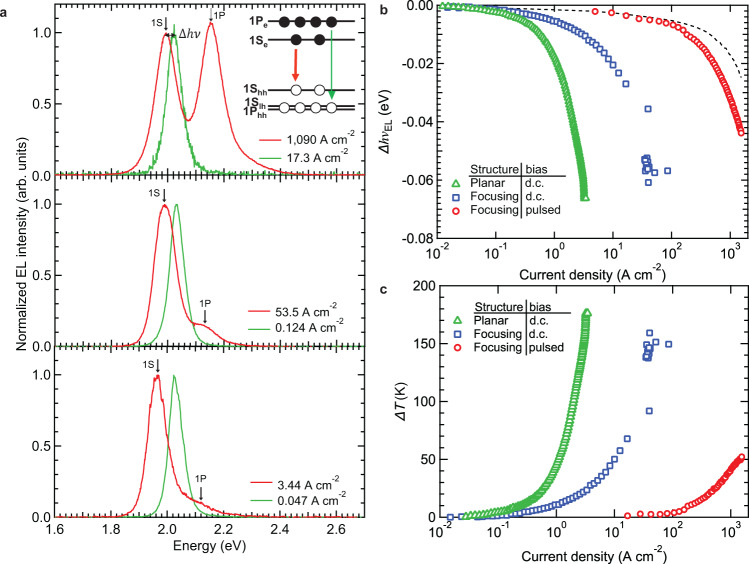
Fig. 2. Effects of current focusing and d.c.-versus-pulsed excitation on EL spectra.
a 1S-peak-normalized EL spectra at low (green) and high (red) current densities for the ‘planar’ LED (bottom, d.c. bias) versus the current-focusing device driven by a d.c. (middle) or a pulsed (top, τp = 1 μs and fp = 100 Hz) bias. For all types of LEDs, the active region contains two cg-QD layers. The redshift of the band-edge 1S band (Δhν) is due to a combination of a Stark effect and Joule heating that prevail, respectively, at low and high j. Inset: Schematic illustration of optical transitions responsible for the band-edge (1S) and higher-energy (1P) EL features in the case of 6 injected excitons. Two of these excitons saturate the 1S band-edge transition and the remaining 4 are ‘forced’ into the higher-energy, sixfold degenerate 1P states. Subscripts hh and lh denote, respectively, heavy and light holes. The 1Slh and 1Phh levels are in close vicinity from each other; hence, higher-energy holes are able to sample both of these states. b The dependence of the shift of the 1S EL peak energy (ΔhvEL) on j for the ‘planar’ (green triangles) and ‘current-focusing’ (blue squares and red circles) LEDs under d.c. (green triangles and blue squares) and pulsed (red circles) biases. The initial slow redshift of the EL peak due to a Stark effect (dashed line) is followed by a rapid decrease in the emission energy due to device heating. c Device overheating (ΔT) as a function of j derived from the EL data in panel b (same colour coding as in b).

