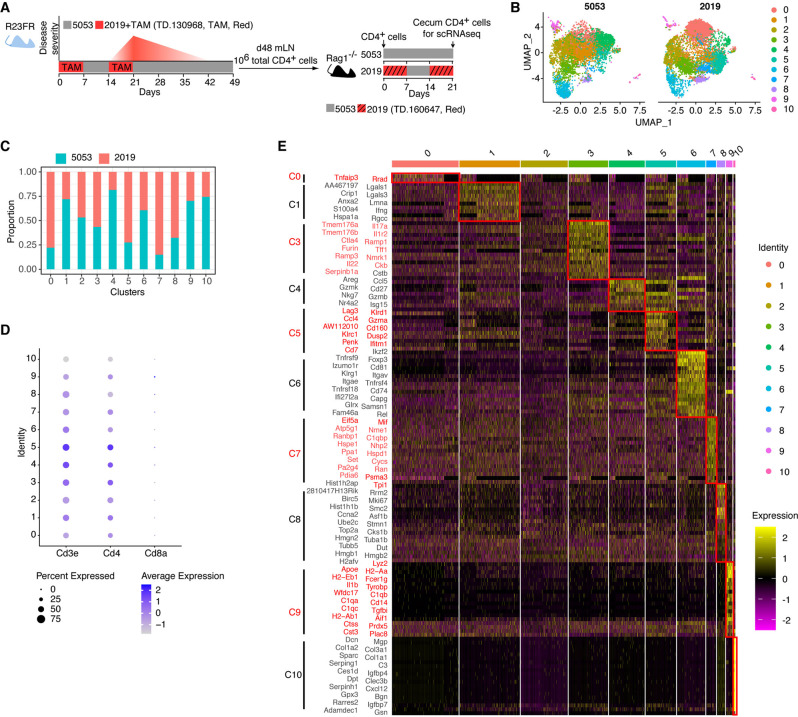
Fig. 1.
Single-cell RNA-seq analysis of cecal CD4+ T cells from adoptively transferred Rag1−/− mice. A Colitis development in R23FR mice depends on CD4+ T cells. R23FR mice were treated with two 7-day cycles of tamoxifen (TAM) dissolved in Diet 2019 containing Red 40. R23FR mice showed colitis after the second cycle of TAM (Day 21). This colitis was transient, and the mice entered remission. Administration of Red 40 to these mice caused a flare of colitis (Day 56). Disease activity is shown in red. Total CD4+ T cells from the mLNs of R23FR mice in remission (Day 48) were enriched with microbeads and transferred into Rag1−/− mice (106 cells/mouse). Recipient Rag1−/− mice were fed with our facility standard diet (Diet 5053) or with two alternating cycles of a Red 40-containing diet, TD.160647 (Diet 2019), for 21 days. Flow-sorted cecal CD4+ T cells from adoptively transferred Rag1−/− mice at Day 21 were used for scRNA-seq analysis. B The UMAP plots showed distinct clustering of cecal CD4+ T cells isolated from adoptively transferred Rag1−/− mice fed Diet 2019 or 5053. C Proportion of cells in each cluster according to the diet used. D Dot plot showing the Cd3e-, Cd4- and Cd8a-expressing cells from the different clusters. The size of the dot corresponds to the percentage of cells expressing the marker in each cluster. The color represents the average expression level. E Heatmap of differential gene expression in each cluster as assessed by scRNA-seq (p value < 0.05, average log2(fold change) >0.7, top 20). The color represents the expression level (log TPM)

