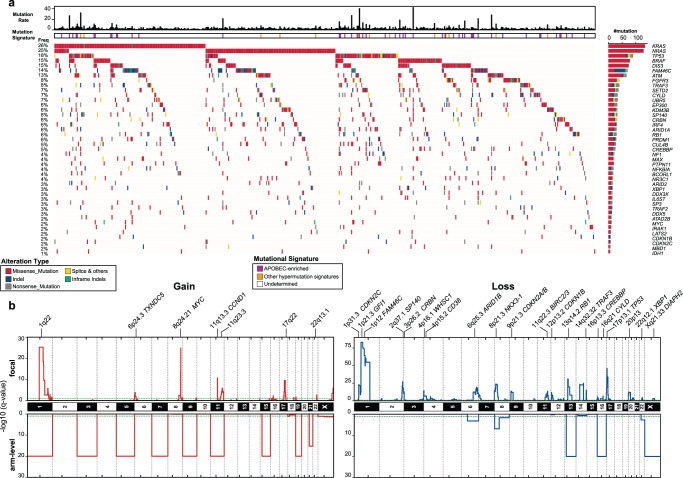
Fig. 1. The landscape of somatic alterations in relapsed refractory multiple myeloma.
a Oncoprint of point mutations and small indels for significantly mutated genes in 511 cases of relapsed and refractory multiple myeloma (RRMM) from the MMRF Molecular Profiling Initiative. The panel of significant genes was derived from an ensemble approach for statistical testing (Methods). Classes of alterations are indicated in the legend. The upper histogram represents the mutation rate (number of point mutations per megabase) per case. APOBEC and non-APOBEC hypermutated cases are indicated. The right histogram represents the number of patients with an indicated mutation in the cohort, with percentages provided on the left. b Consensus plot for arm-level (lower panel) and focal copy-number alterations (upper panel). Gains are shown in red and losses in blue. Relevant genes in the recurrent gain or loss regions are indicated. The q-values were calculated by GISTIC2.0. Horizontal dashed green lines correspond to q value = 0.05.

