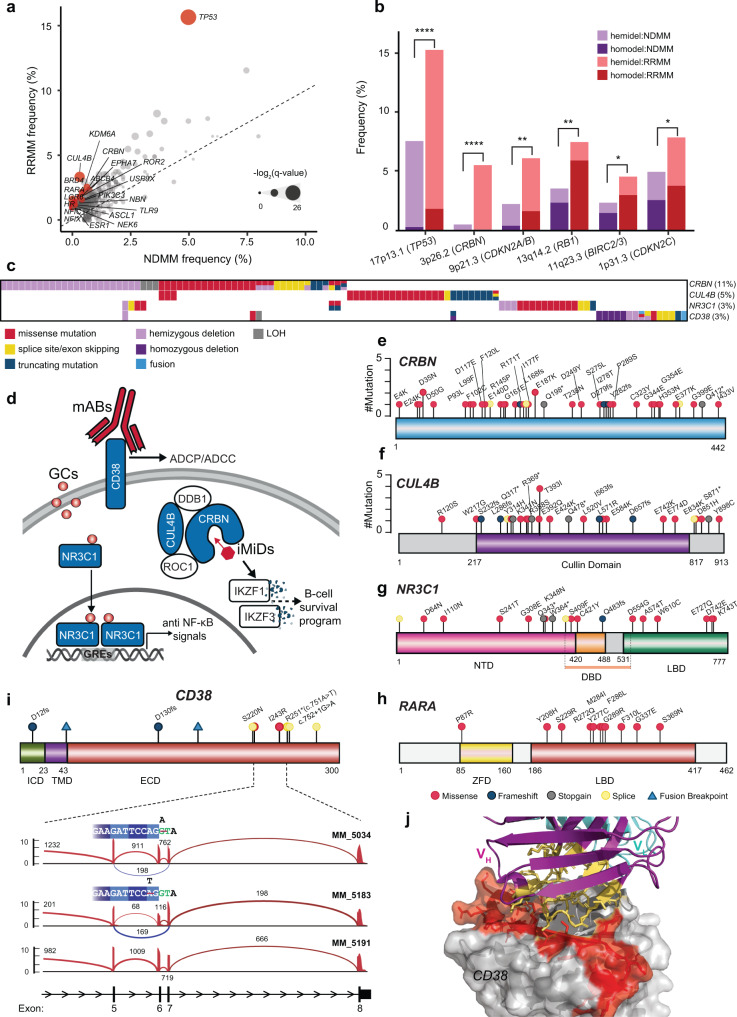
Fig. 4. Alterations enriched in relapsed refractory multiple myeloma associated with drug resistance or disease progression.
a Scatter plot of mutation frequency in RRMM vs. NDMM. The size of the circles correlates with log2 of q value two-sided Fisher exact test. Genes with top coefficients from the regression model (Methods) are highlighted in red. b Comparison of focal deletions (less than 20MB) in NDMM vs. RRMM. *, **, *** indicate P < 0.05, 0.01, 0.001, respectively for the two-sided Fisher exact test. P values obtained: 7.1 × 10⁻⁶ (TP53), 1.4 × 10⁻⁹ (CRBN), 1.3 × 10⁻⁴ (CDKN2A/B), 2.2 × 10⁻³ (RB1), 0.025 (BIRC2/3), and 0.035 (CDKN2C). c Heatmap of drug resistance-related genes identified in RRMM. The types of alterations are indicated in the legend. There were cases with alterations observed in more than two genes or different types of alterations per gene, reflecting the complex history of tumor evolution through several treatments. d Overview of therapies in MM with observed resistance mechanisms. Genes highlighted in blue are resistance mutations found in RRMM. ADCP antibody-dependent cellular phagocytosis, ADCC antibody-dependent cellular cytotoxicity, mABs monoclonal antibodies, GCs glucocorticoids, iMiDs immunomodulatory imide drugs. e–h Lollipop plots for CRBN, CUL4B, NR3C1, and RARA. i Top panel, lollipop plot for CD38. Frameshift mutations would completely abolish CD38, and fusions that truncate the extracellular domain would disrupt binding events. Bottom panel, Sashimi plot for two cases with exon 6 skipping. MM_5034 had a splice donor mutation. MM_5183 had a missense mutation that was two nucleotides upstream of the splice site, which would naturally introduce a new stop codon (R251*). Unexpectedly, this mutation functioned as a splice donor mutation instead, which also induced the skipping of exon 6. MM_5191 is included as a control. j The skipping of CD38 exon 6 in MM_5034 and MM_5183 was in-frame and would delete 29 amino acids (highlighted in red), including the epitope of daratumumab (PDB structure 7DUO)52.

