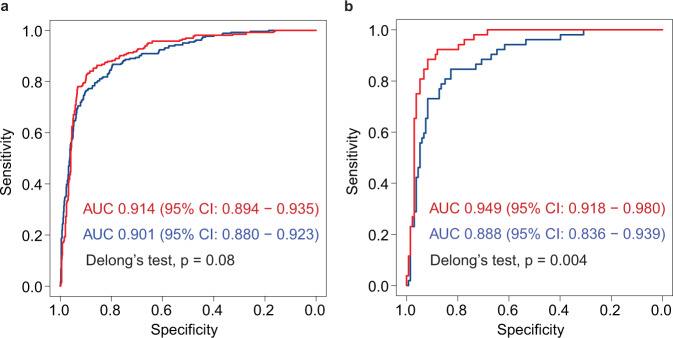
Fig. 3. The ROC curves of HTNet with and without integration of serologic markers on static-image and video stream testing sets.
a The first internal-testing set of static images, (b) the second internal-testing set of video stream. Red and blue ROC curves indicate HTNet with and without integration of serologic markers, respectively. Two-sided Delong’s test is used to test the difference between two ROC curves. Area under the operating curve and associated 95% confidence intervals are included.

