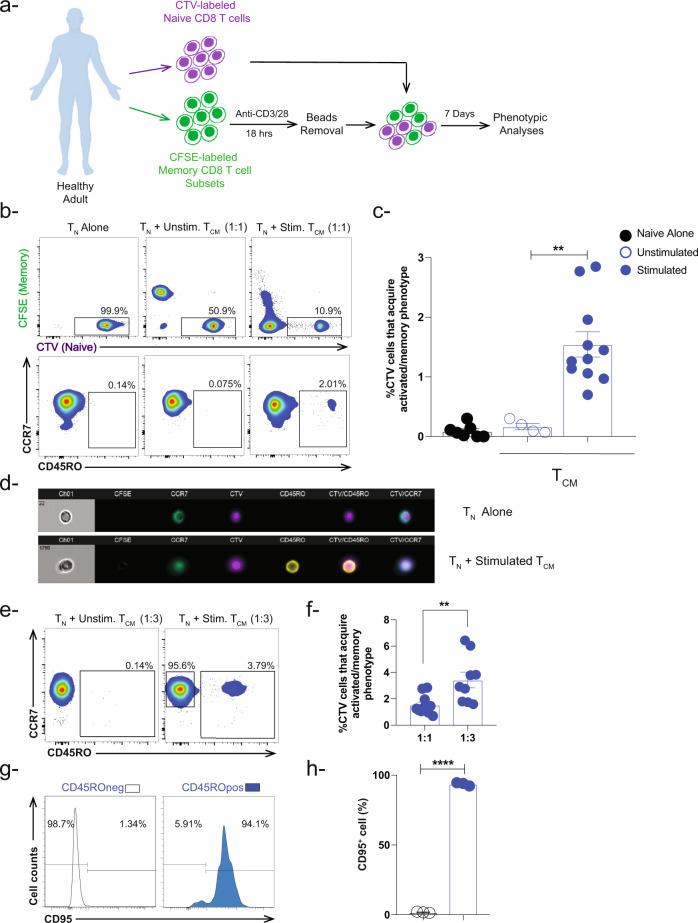
Fig. 1. Human naïve CD8 T cells undergo phenotypic changes in the presence of autologous activated memory CD8 T cells.
a In vitro co-culture schema showing stimulation of sorted CFSE-labeled human memory CD8 T cell subsets with anti-CD3/CD28 magnetic beads (1:1 ratio). After overnight stimulation, the beads were removed using a plate magnet followed by incubation with CTV-labeled naïve CD8 T cells for 7 days (memory:naive ratio [1:1 ratio and 3:1 ratio]). CTV-labeled cells were examined for activated/memory phenotype. b Representative flow cytometry plots depicting gating strategy for live CTV-naïve CD8 T cells expressing CCR7+/− CD45RO+ under three conditions: (TN) alone, naïve co-cultured with unstimulated TCM, or with stimulated TCM. The gating strategy includes CTV+/int subpopulations and excludes CTVneg cells. This gating strategy has been used in the analyses to exclude CFSEneg activated memory CD8 T cells which might overlap with the CTVneg population. c Bar-graph showing percent of CTV-labeled naïve CD8 T cells that acquire activated/memory phenotype based on CCR7 and CD45RO cell surface expression in the presence of stimulated TCM (blue box) at 1:1 ratio (TCM:TN). Naïve CD8 T cells were cultured alone or in the presence of unstimulated TCM and were used as controls. Blue closed circles depict stimulation conditions, while open circles depict unstimulated conditions (n = 4–11 healthy donors). d Representative image (n = 1) showing cell surface markers expressed by CTV-labeled naïve CD8 T cells alone and in the presence of stimulated TCM CD8 T cells using advanced imaging flow cytometry. e Representative flow cytometry plots and f Bar-graph showing the percentage of CTV-labeled naïve CD8 T cells that acquire an activated/memory phenotype in the presence of stimulated TCM at 3:1 (n = 9) and 1:1 (n = 11) ratio (TCM:TN). g Histograms showing expression of CD95 (activation/memory marker) in both subpopulations CTV+ CD45ROneg and CD45RO+ in the presence of CFSE-labeled activated TCM CD8 T cells. h Bar-graph showing percent of cells expressing CD95 (n = 3) **P < 0.01 ****P < 0.0001. Unpaired nonparametric Mann-Whitney test was used. Data are presented as means ± SEM.

