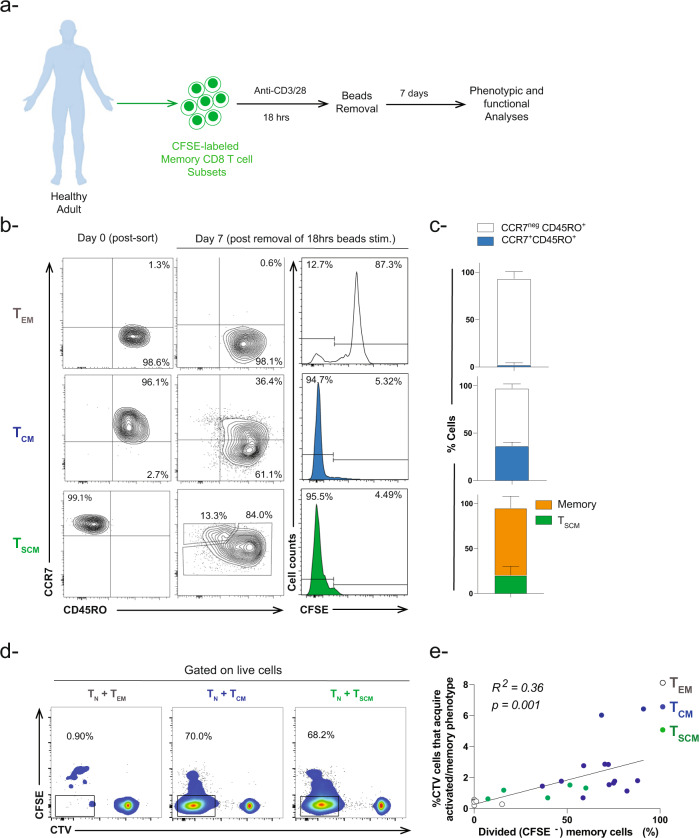
Fig. 2. Phenotype and proliferation capacity of activated memory CD8 T cell subsets.
a Experimental setup diagram for activation of memory CD8 T cell subsets. b Representative flow cytometry contour plots showing the phenotype of memory CD8 T subsets at Day 0 and Day 7 after removal of anti-CD3/CD28 stimulation. Histograms showing proliferation of CFSE-labeled memory CD8 T cell subsets. c Bar-graph showing the percentage of memory CD8 T cells that maintain or change their phenotype following removal of TCR stimulation (n = 3–6). d Representative flow cytometry plots showing proliferation of CFSE-labeled activated memory CD8 T cell subsets in the presence of CTV-labeled naïve CD8 T cells. The percent in the graph represents the proportion of dividing memory CD8 T cells (CFSEneg). e Pearson coefficient correlation analyses between percent of dividing memory CD8 T cell subsets in the presence of naive CD8 T cells versus percent of naïve CD8 T cells that acquired an activated/memory phenotype. Simple linear regression test was applied between the two variables (n = 24, R2 = 0.36 p = 0.001).

