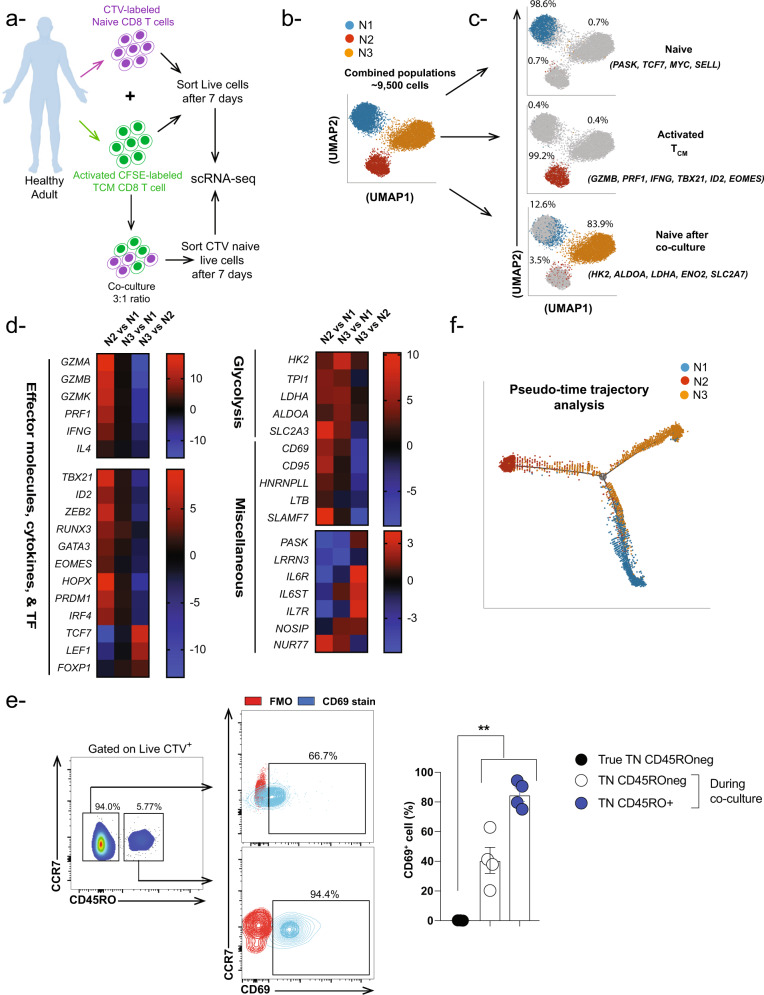
Fig. 6. Activated TCM CD8 T cells induce transcriptional changes in autologous naïve CD8 T cells.
a Experimental setup for scRNA analyses from one healthy donor. b, c UMAP analyses (focusing on top 100 genes) showing percentage of each neighborhood per sorted cell population including CTV naïve CD8 T cells cultured alone for 7 days (Blue neighborhood-N1), CFSE activated TCM CD8 T cells cultured alone for 7 days (Red neighborhood-N2), and CTV naïve CD8 T cells sorted from the co-culture mix which contains blue, red and orange (Orange-hybrid) neighborhoods. d Heat maps depicting genes upregulated in activated memory vs naive neighborhoods (N2 vs N1), hybrid vs naïve neighborhoods (N3 vs N1), (N2 vs N1) as well as downregulated in hybrid vs activated memory T cells (N3 vs N2). e FACS plots and bar-graph showing expression of CD69 cell surface activation marker within CTV+ CD45ROneg and CTV+ CD45RO+ sub-populations following co-culture of CTV-labeled naïve CD8 T cells with CFSE-activated TCM CD8 T cells (3:1 ratio-memory:naïve) compared to naïve CD8 T cells in the absence of activated memory CD8 T cells. Red contour plots represent FMO (full minus one) control, while blue contour plots represent CD69 staining. One-way ANOVA Bonferroni multiple comparison test was used **P < 0.01. Data are presented as means ± SEM (n = 3-4). f Pseudotime temporal analyses showing the differentiation trajectory of N1, N2, and N3 based scRNA-seq gene expression data.

