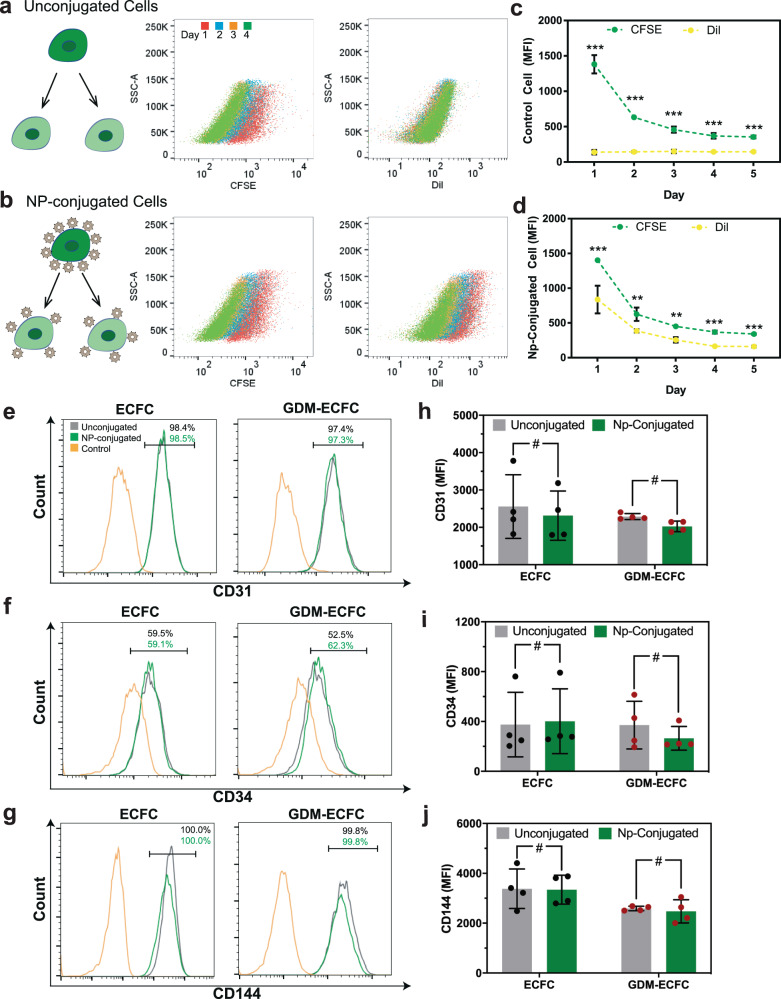
Fig. 2. Characterization of key ECFC phenotypes.
CFSE-labelled ECFCs were (a) unmanipulated as control unconjugated cells or (b) conjugated with 5000 Dil-labeled multilamellar lipid nanoparticles per cell. Scatter plots demonstrate that nanoparticles remained on the cell surface and split equally among daughter cells. Quantification of mean fluorescence intensity (MFI) of CFSE and Dil over 5 days for (c) control unconjugated cells and (d) nanoparticle-conjugated cells (mean ± s.d., three independent experiments conducted in triplicate). Expression of cell surface markers (e) CD31, (f) CD34, and (g) CD144 were examined using flow cytometry for NP-conjugated cells (green lines) and compared to unconjugated cells (grey lines) and isotype controls (yellow lines). Nanoparticle-conjugated cells and their unconjugated counterparts expressed comparable levels of ECFC-specific markers, based on their MFIs quantified for (h) CD31, (i) CD34, and (j) CD144. Four biological replicates (n = 4; mean ± s.d.) were used for normal ECFCs (black data dots) and GDM-ECFCs (red data dots). Statistical significance was set at #P > 0.05, **P < 0.01, ***P < 0.005. Representative histograms from individual ECFC line can be found in Supplementary Fig. 6.

