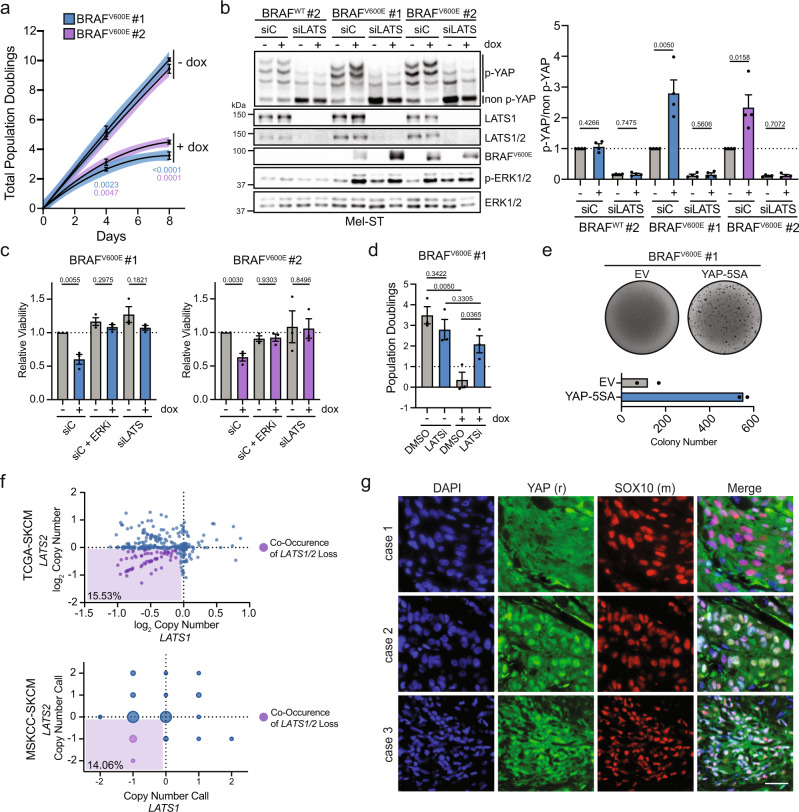
Fig. 3. Oncogenic BRAF-induced Hippo pathway activation restrains melanocyte growth.
a Population doubling assay of two dox-inducible BRAFV600E Mel-ST clones ± dox (n = 3 independent experiments, lines represent second-order polynomial non-linear fit, line color represents 95% confidence interval (dots show mean ± SEM, two-tailed unpaired t test). b Left, representative IB of two dox-inducible Mel-ST clones treated with control siRNA (siC) or LATS1 and LATS2 siRNAs (siLATS) ± dox for 24 h; right, intensity quantification of YAP phos-tag (n = 4 independent experiments, graph shows mean ± SEM, two-tailed unpaired t test). c Relative viability of Mel-ST cell lines treated with indicated siRNA or drugs for a 4-day period (n = 3 independent experiments in technical quintuplicate, graphs show mean ± SEM, two-tailed unpaired t test). d Number of population doublings of indicated dox-inducible Mel-ST clone over 4 days treated with either DMSO or a LATS1/2 inhibitor (LATSi), ± dox (n = 3 independent experiments, graph shows mean ± SEM, two-tailed unpaired t test). e Representative crystal violet stain of dox-inducible BRAFV600E Mel-ST cell line expressing indicated genes grown in dox-containing soft agar with quantification below (n = 2 independent experiments in technical triplicate, graph shows mean). f Plot of log2 copy-number values from TCGA-SKCM or GISTIC 2.0 calls from MSKCC-SKCM databases for the genes LATS1 and LATS2; bottom left percent is the frequency of LATS1/2 co-heterozygous loss. g Representative immunofluorescence staining of indicated proteins in three human melanoma cases, scale bar = 25 µm). Source Data are provided as a Source Data file.

