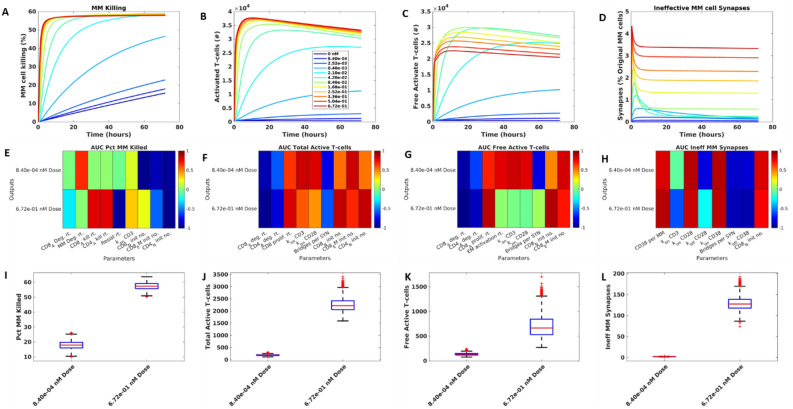
Figure 3.
Efficacy at low doses increases with increasing synapse number while high dose level efficacy is driven by decreasing the number of ineffective synapses through better access to active T-cells. One set of values from the final population was selected and run for three days for different doses of interest. The results for tumor killing (A), Total active T-cells (B), Free active T-cells (C), and ineffective T-MM synapses (D). The sensitivity of these outputs to parameters is plotted as an AUC heatmap, where dark red = positive correlation, dark blue = negative correlation (E–H). Sensitivity is shown at two doses, indicated on plots. Parameters shown in each heatmap have 80% or more correlation to least one evaluation metric (such as AUC) derived from the corresponding output. Variability of each output across doses in the sensitivity analysis population (I–L).

