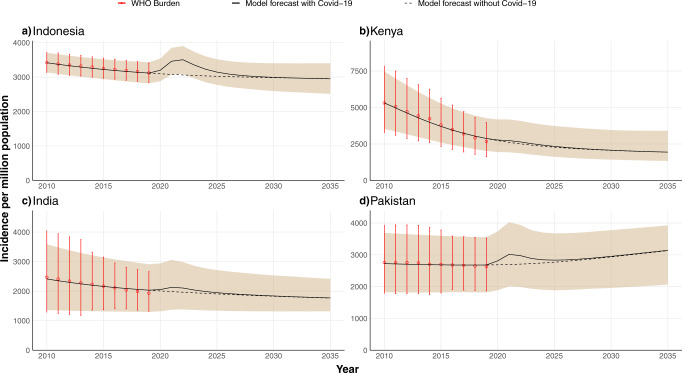
Fig. 2. Projected annual TB incidence in four high-burden countries over the period 2020–2035.
The data-driven model is calibrated with WHO incidence data up to 20193. The shaded area represents the 95% CI and the black line is the median of the model outcome for 500 independent runs of the disrupted scenario. The dotted black line is the model forecast for the scenario in which there was no Covid-19 pandemic. Red dots with error bars are the TB burden provided by the WHO3 used for calibration. Projected incidence values are calculated at the end of the corresponding year on the x-axis. The impact of COVID-19 is modeled as a reduction in diagnosis rates and treatment completion for 2 years (2020 and 2021), see Fig. 1 and main text. The four countries considered are (a) Indonesia, (b) Kenya, (c) India, (d) Pakistan, which account for 42.1% of the total number of TB infections worldwide.

