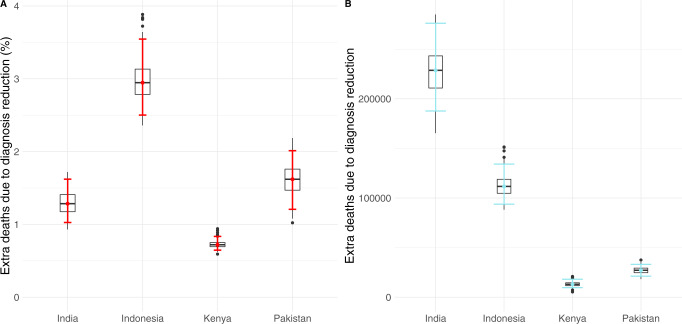
Fig. 3. Model predictions of additional TB-related deaths due to COVID-19-related disruptions in healthcare systems.
Error bars are the 95% CI of 500 independent runs of the model. A Percentage of increase of mortality in comparison to the baseline scenario in 2035 for each of the four countries studied. B Cumulative number of excess deaths caused by the pandemic impact during the whole time window simulated (2020–2035) for each country under study as indicated in the x-axis.

