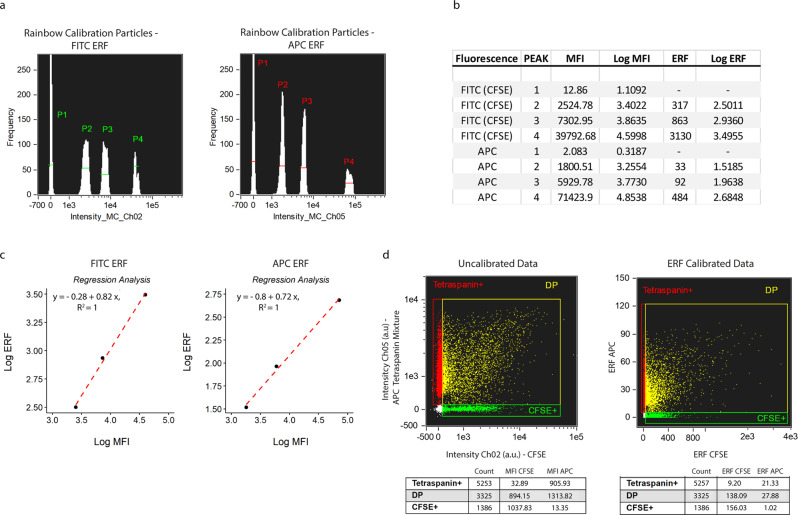
Fig. 4. Fluorescent calibration allows reporting of fluorescent intensities in standardized units.
a The median fluorescent intensities (MFI) of each peak of FITC and APC ERF (Equivalent number of Reference Fluorophores) calibration beads was measured with the same instrument/acquisition settings applied as used for EV acquisition. b Calculation of the log of the MFI and ERF values (provided by the bead manufacturer). c For each of the used detection channels, the log of the MFI corresponding to the fluorescent peaks (P2-P4) was plotted on the x-axis, and the log of the ERF values on the y-axis; linear regression analysis was performed. d Representative example of uncalibrated data (left) and corresponding ERF calibrated data (right).

