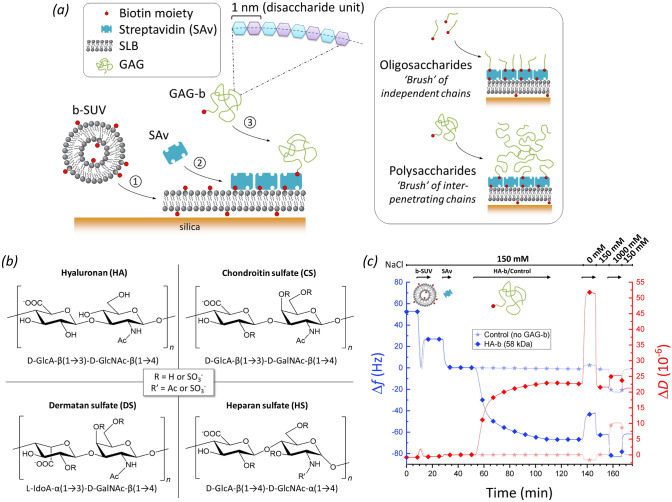
Figure 1.
Experimental setup for GAG-sizing by QCM-D. (a) Schematic displaying the surface functionalisation steps: ① Formation of a supported lipid bilayer (SLB) on the quartz crystal sensor surface (silica) from small unilamellar vesicles containing 5 mol.% biotinylated lipids (b-SUVs); ② Formation of a streptavidin (SAv) monolayer (reference surface); ③ Anchorage of GAGs of various sizes via a biotin at their reducing end (GAG-b). All molecules are drawn roughly to scale, except the GAG polysaccharides for which the linear dimensions can exceed SAv by tenfold and more. (b) Disaccharide unit structures of the GAG types studied, including positions of potential sulfations (for CS, DS and HS; additionally, GlcA units of HS may be epimerised into IdoA). (c) Representative QCM-D experiment monitoring all typical incubation steps. Shifts in normalised frequency (Δf; blue lines) and dissipation (ΔD; red lines) for the third overtone (i = 3) are shown for an experiment with HA-b (58 kDa; lines with diamonds) and for an experiment without any GAG-b (control; lines with stars). The start and the duration of sample incubation steps are indicated by the arrows above the graph along with the NaCl concentration step profile. Incubation conditions: buffer—10 mM HEPES, pH 7.4, with NaCl as indicated; b-SUVs—50 μg/mL; SAv—20 μg/mL; HA-b (58 kDa)—5 μg/mL.

