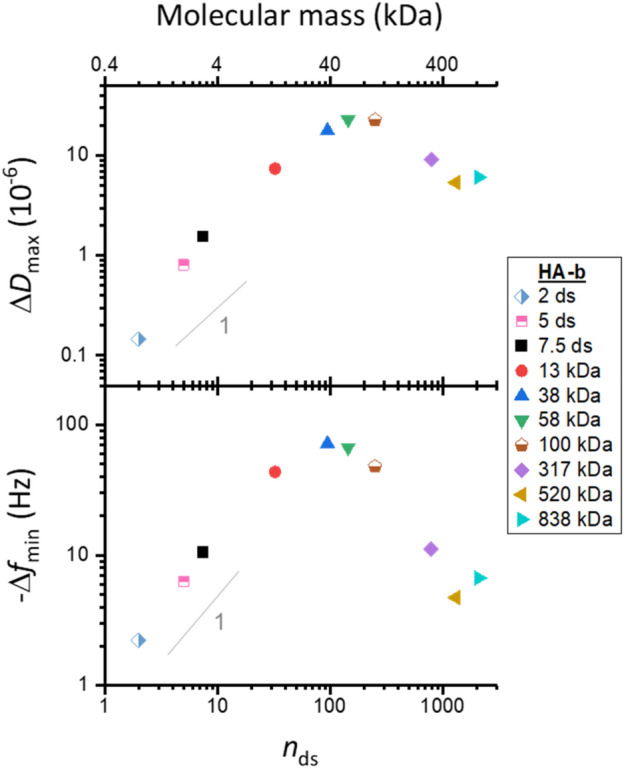
Figure 2.

Maximal QCM-D responses vary non-monotonically with HA size. Double-logarithmic plots with shifts in dissipation (ΔDmax) and normalised frequency (− Δfmin; i = 3) at maximum GAG binding as a function of the mean number of disaccharides, nds, per chain. Estimated experimental uncertainties (accounting for baseline drift upon HA binding: 0.67 × 10⁻⁶ for ΔD and 0.33 Hz for Δf per hour) are smaller than the symbol size and not shown. Grey lines with a slope of one are shown for reference: − Δfmin increases roughly linearly with HA size for small HA sizes. Incubation conditions: HA-b oligosaccharides (2, 5 and 7.5 ds; all chains 3 kDa) and HA-b polysaccharides (13, 38, 58 and 317 kDa)—5 μg/mL; HA-b 100 kDa—10 µg/mL; HA-b 520 kDa and HA-b 838 kDa—20 μg/mL; see Fig. S2 for original data.
