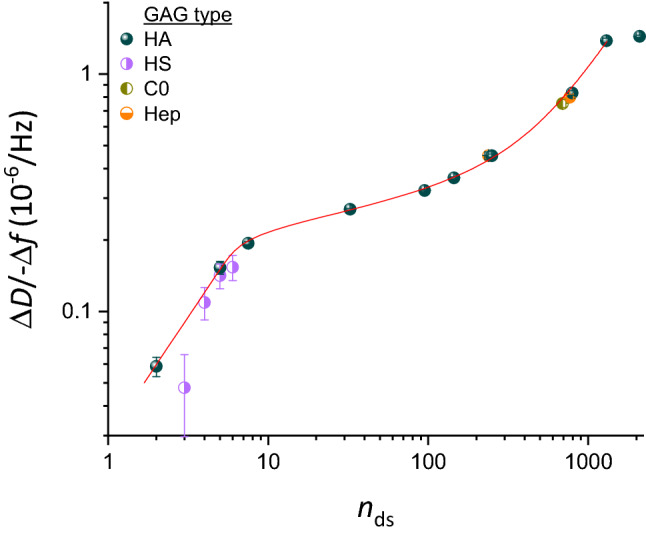
Figure 4.

Standard curve for sizing HA, and extension to other GAG types. Double logarithmic plot of ΔD/− Δf (i = 3; frequency shifts are normalised by i) at low GAG surface density (− Δf = 2.5 Hz) as a function of the mean number of disaccharides per GAG-b chain, nds (mean ± 5%, except for oligosaccharides which were taken to be pure in size, see Table 1). Data for all size-defined HA-b samples (blue spheres) represent mean ± standard error of the mean from between two and four independent experiments (see Fig. S4 for details). The data for HA up to nds = 1300 are faithfully reproduced and interpolated by Eq. (1) (red line), representing the standard curve for GAG sizing. Data for size-defined preparations of other GAG types (half-filled circles; see Fig. S6 for original data) are also seen to map onto the standard curve: four heparan sulfate (HS-b; violet) oligosaccharides, two heparosan (Hep-b; orange) and one chondroitin (C0-b; dark yellow) polysaccharide. Symbols and error bars for non-HA GAGs represent individual experiments with the mean ± standard deviation time-averaged over − Δf values ranging between 2 and 3 Hz.
