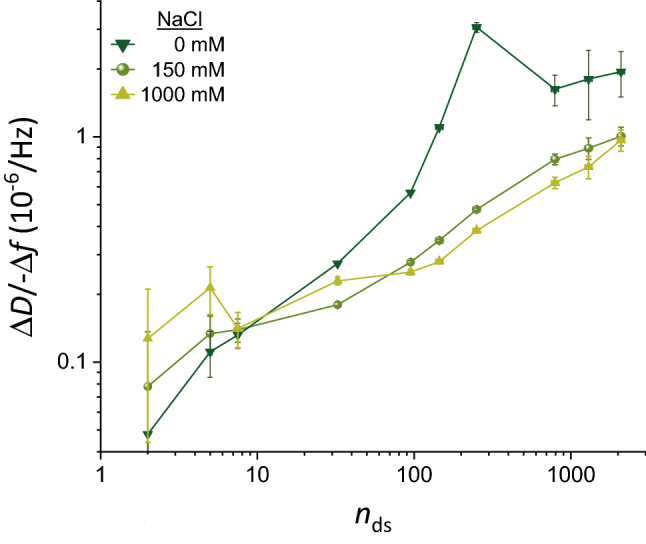
Figure 5.

Effect of ionic strength on ΔD/− Δf ratios. Double logarithmic plot of ΔD/− Δf (i = 3; frequency shifts are normalised by i) as a function of the mean number of disaccharides (nds) per HA chain, for NaCl concentrations of 0 mM, 150 mM and 1000 mM (as indicated with symbol and colour code). Representative data for one experiment per HA size are shown. The mean values represent the ΔD/− Δf ratio measured at high GAG surface densities (i.e., the maximal surface densities that were attained in the experiments and stable at 0 mM NaCl; see Fig. S2 for original data). The error bars account for baseline drifts during GAG binding. In the cases of 0 and 1000 mM NaCl, solution effects on the QCM-D response (i.e., owing to the effect of salt on solution density and/or viscosity) needed to be corrected for with the aid of control data, and uncertainties associated with this correction are also included in the error bars (see Fig. 1c and Supplementary Methods for details).
