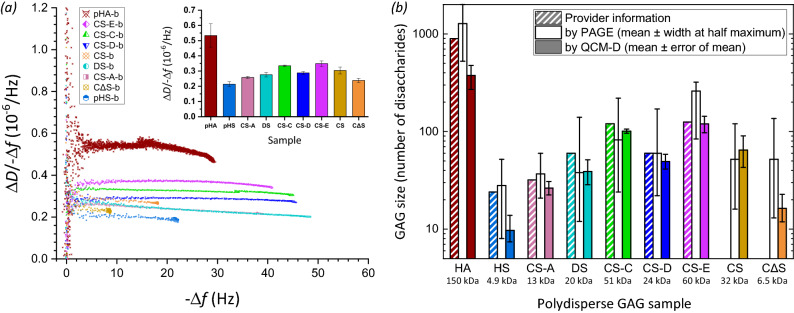
Figure 6.
Application examples of chain sizing natural, isolated GAG preparations. (a) Plot of the ΔD/− Δf ratio versus − Δf (i = 3; frequency shifts are normalised by i) for various polydisperse GAG-b polysaccharide preparations of HA and other GAG types (chondroitin sulfate – CS, CS-A, CS-C, CS-D and CS-E, chemically desulfated CS—CΔS, dermatan sulfate – DS, heparan sulfate – HS; symbols and colour codes as indicated). Original QCM-D data are shown in Fig. S9. The inset shows the ΔD/− Δf values at − Δf = 2.5 Hz, as mean ± standard deviations for − Δf values ranging between 2 and 3 Hz. (b) Comparison of the effective size (in number of disaccharides nds) of surface-grafted GAG-b polysaccharides (as determined by QCM-D; filled bars) with the effective size distribution of GAG-b polysaccharides in solution (as determined by PAGE; unfilled bars) and the size estimates of the original GAGs given by the provider (bars with diagonal lines; taking disaccharide masses to be 400 Da for HA, and 500 Da for all sulfated GAGs). To calculate GAG sizes from QCM-D data, the ΔD/− Δf values at − Δf = 2.5 Hz of the polydisperse GAG-b preparations were compared with the standard curve (Fig. 4 and Eq. 1). To calculate the effective size distribution from PAGE data, the migration distances of the peak intensity and the half-maximal intensities above background were compared to the migration distances of size-defined HA standards (Fig. S8). The effective molecular masses of surface-grafted GAGs (in kDa) are given below the GAG names, and were derived from nds with disaccharide masses of 400 Da for HA and CΔS, and 500 Da for all sulfated GAGs.

