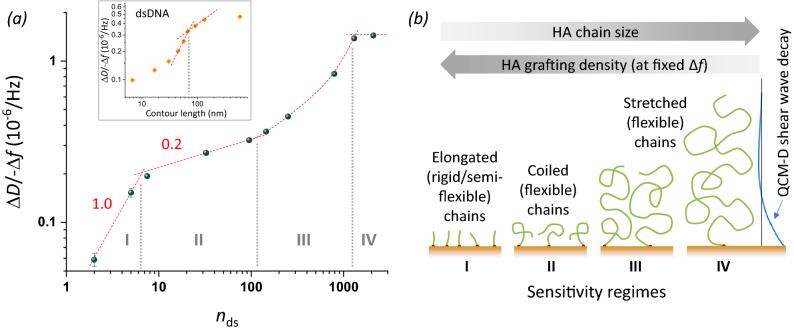
Figure 8.
Sensitivity regimes of HA and underpinning mechanisms. (a) Double-logarithmic plot of the ΔD/− Δf ratio (i = 3) at low HA surface density (− Δf = 2.5 Hz) as a function of the mean number of disaccharides, nds. Data for HA (blue spheres with error bars) are reproduced from Fig. 4. Sensitivity regimes I–IV are separated by vertical grey dotted lines. Regimes I and II are discerned by their distinct power-law dependencies (red dashed lines with slope illustrate the approximate power); regime III does not obey a power law (red curved dashed line illustrates the trend) and regime IV is close to a plateau/maximum (indicated by a horizontal line). The inset shows equivalent data for dsDNA extracted from Fig. 3 of Ref.46, with two selected power law dependencies (dashed red lines). (b) Illustration of the proposed model to explain the observed sensitivity regimes. Both HA chain size and grafting density (which decreases with increasing chain size at the set − Δf = 2.5 Hz) influence chain conformation, and distinct chain conformations are associated with sensitivity regimes I, II and III; ultimately, chain stretching exceeds the QCM-D sensing depth leading to a ΔD/− Δf maximum and vanishing size sensitivity in regime IV.

