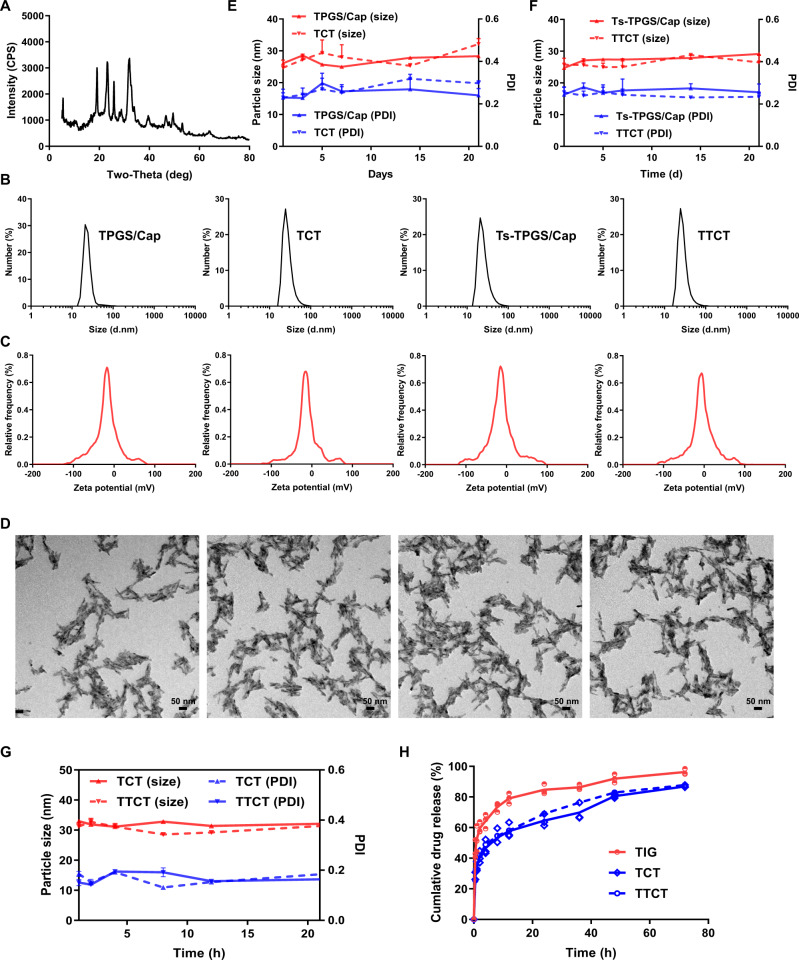
Fig. 3. Preparation and characterization of TTCT.
A X-ray diffraction of TPGS/Cap nanorods. B Size distribution measured by DLS, C zeta potential distribution, and D representative TEM images of TPGS/Cap, Ts-TPGS/Cap, TCT, and TTCT (Scale bar = 50 nm). Particle size and PDI changes of E TPGS/Cap, Ts-TPGS/Cap, (F) TCT, and TTCT during 1 week of storage (n=3 independent experiments). G Changes in particle size and PDI of TCT and TTCT in 10% fetal bovine serum (FBS)-containing PBS (n = 3 independent experiments). H In vitro drug release profiles of TCT and TTCT in 10% fetal bovine serum (FBS)-containing PBS at pH 7.4 and 37 °C (n = 3 independent experiments). TIG free tigecycline, TPGS/Cap TPGS-functionalized calcium phosphate nanorods, TCT tigecycline loaded TPGS/Cap nanorods, TTCT tigecycline-loaded Ts-TPGS/Cap nanorods. Data are expressed as the mean ± SD, and the mean value is the average of three independent experiments. The experiments in B–D were repeated independently for three times with similar results. Source data are provided as a Source Data file.

