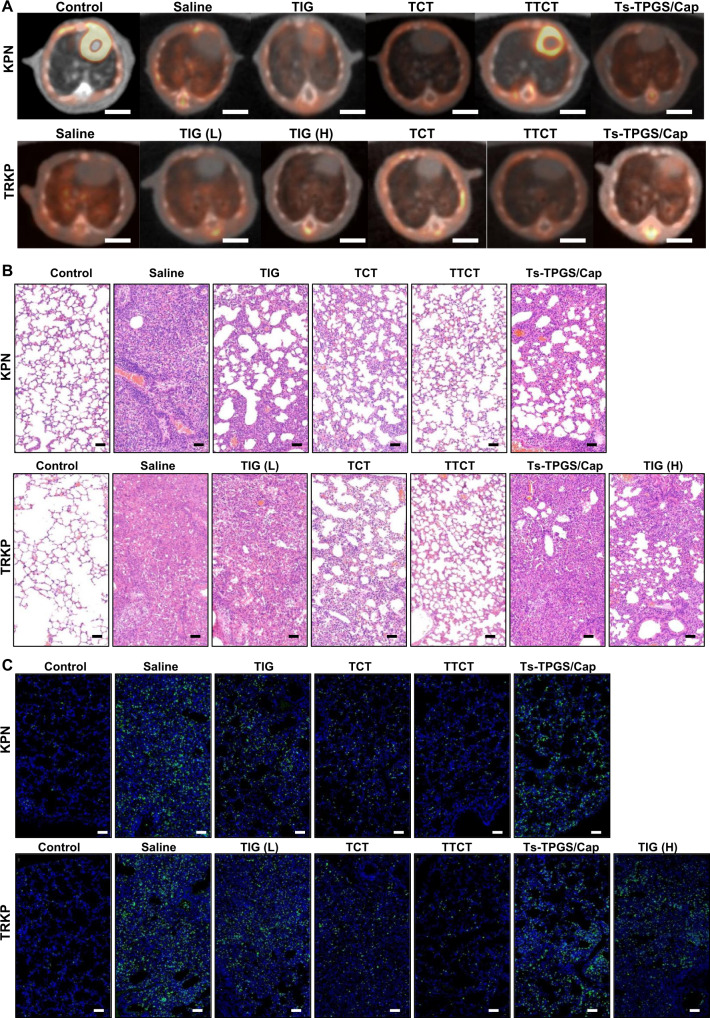
Fig. 8. Histopathology observation of lung tissue.
A Representative images of the lungs observed by PET-CT after administration to various groups (Scale bar = 5 mm). B Representative images of lung tissue from different groups after H&E staining (scale bar = 50 µm). C Fluorescent images of the lung tissue collected from mice with pneumonia and stained with anti-MPO antibody, in which the green channel indicates neutrophil infiltration and the blue channel represents the nucleus. Scale bar = 50 µm. TIG free tigecycline, TIG(L) low dose of tigecycline (15 mg/kg), TIG (H) high dose of tigecycline (45 mg/kg), TCT tigecycline loaded TPGS/Cap nanorods, TTCT tigecycline-loaded Ts-TPGS/Cap nanorods, KPN Klebsiella pneumonia, TRKP tigecycline-resistant Klebsiella pneumonia. The experiments in B, C were repeated independently for three times with similar results.

